Trade of the Day: USD/JPY
By: Dima Chernovolov
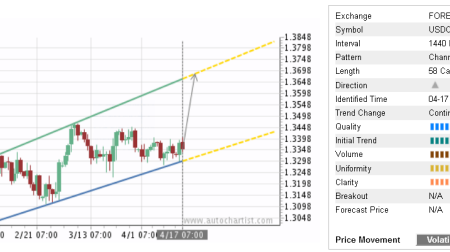
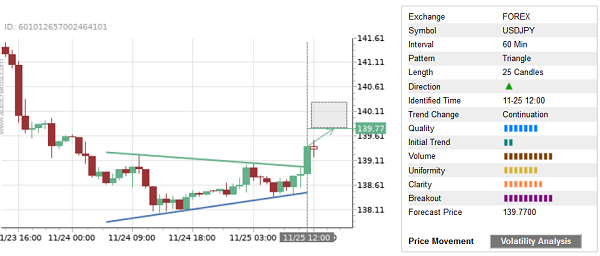
USD/JPY today broke the hourly Triangle chart pattern, which was recently identified by Autochartist. Autochartist rates the quality of this Triangle at the 7-bar level – which is the result of the slow Initial Trend (2 bars), significant Uniformity (7 bars) and higher Clarity (8 bars). USD/JPY is expected to rise toward the forecast price 139.77.
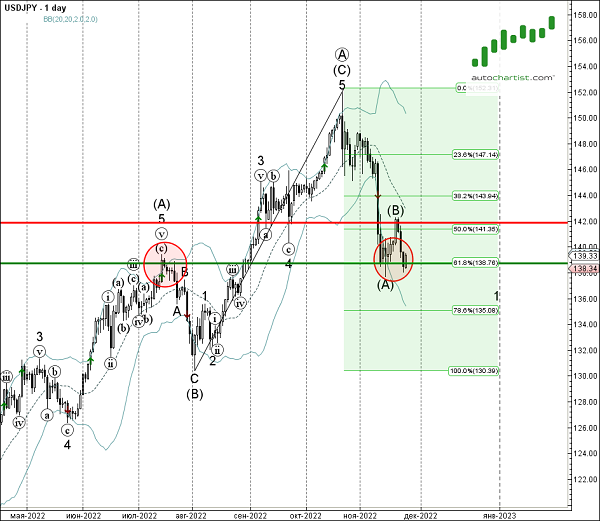
As can be seen from the daily USD/JPY chart below – the pair earlier reversed up from the support area located between the key support level 138.70 (former strong resistance from July), lower daily Bollinger Band and the 61.8% Fibonacci correction of the upward impulse from August. The proximity of this support area and the clear daily uptrend add to the probability USD/JPY will continue to rise toward the forecast price 139.77.