Trade of the Day: USD/JPY
By: Dima Chernovolov
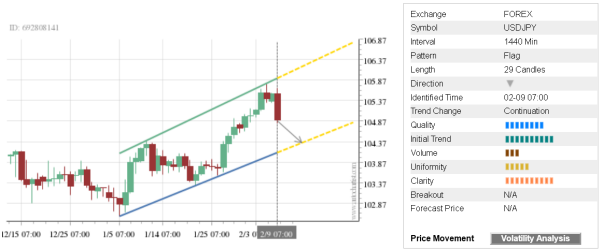
USD/JPY continues to rise inside the daily Flag chart pattern which was previously identified by Autochartist. Autochartist rates the quality of Flag at the 8-bar level – which is the result of the strong Initial Trend (10 bars), average Uniformity (5 bars) and near-maximum Clarity (9 bars). USD/JPY is expected to fall further inside this Flag – in line with the earlier downward reversal form the resistance area shown below.
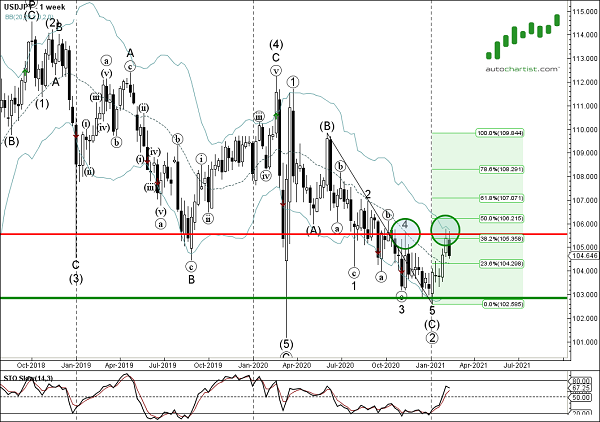
As can be support from the weekly USD/JPY chart below, the price earlier reversed down from the strong resistance area lying between the key resistance level 105.50 (monthly high from November), upper weekly Bollinger Band and the 38.2% Fibonacci correction of the weekly downward impulse from last year. The proximity of this resistance area adds to the probability USD/JPY will continue to fall inside this Flag.