Trade of the Day: USD/JPY
By: Dima Chernovolov
USD/JPY recently broke the daily Falling Wedge chart pattern which was recently identified by Autochartist. Autochartist rates the quality of this Falling Wedge at the 6-bar level – which is the result of the strong Initial Trend (9 bars), medium Uniformity and Clarity (5 bars). USD/JPY is expected to rise toward the forecast price 108.15 – in line with the earlier upward reversal from the key support zone shown below.
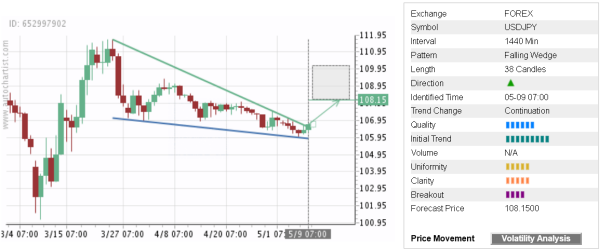
As can be seen from the daily USD/JPY chart below – the bottom of this USD/JPY formed near the support zone located between the support level 106.30, lower daily Bollinger Band and the 50% Fibonacci retracement of the previous upward impulse from March. The proximity of this support zone increases the probability USD/JPY will continue to rise toward the forecast price 108.15.