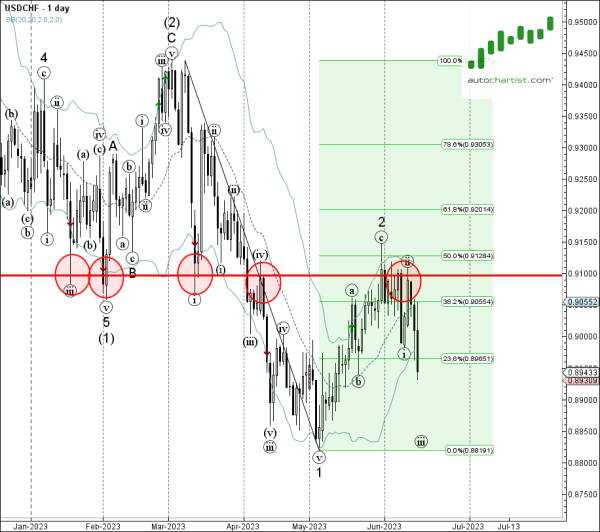
Trade of the Day: USD/CHF
USD/CHF recently broke the daily Triangle chart pattern, which was recently identified by Autochartist. Autochartist rates the quality of this Triangle at the 6-bar level – which is the result of the slow Initial Trend (2 bars), average Uniformity (5 bars) and substantial Clarity (8 bars). USD/CHF is expected to fall toward the forecast price 0.8932.
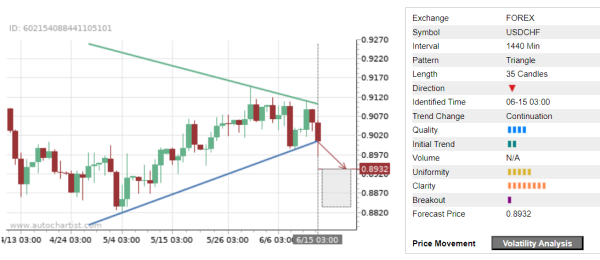
As can be seen from the daily USD/CHF chart below – the pair earlier reversed down from the strong resistance area located between the key resistance level 0.9100 (former strong support from January, February and March), upper daily Bollinger Band and the 50% Fibonacci correction of the previous sharp downward impulse from March. The proximity of this resistance zone and the strong daily downtrend increase the probability USD/CHF will continue to fall toward the forecast price 0.8932.