Trade of the Day: USD/CHF
By: Dima Chernovolov
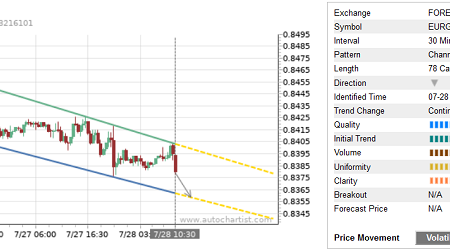
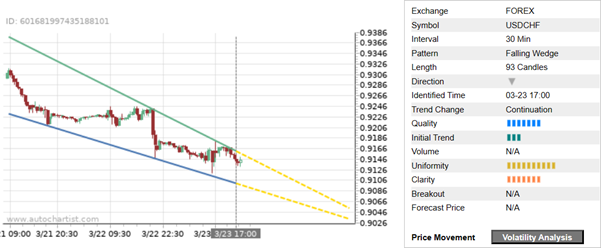
USD/CHF continues to fall inside the 30-minute Falling Wedge chart patter, which was recently identified by Autochartist. Autochartist rates the quality of this Falling Wedge at the 7-bar level – – which is the result of the slower Initial Trend (3 bars), maximum Uniformity (10 bars) and significant Clarity (7 bars). USD/CHF is expected to fall further inside this Falling Wedge.
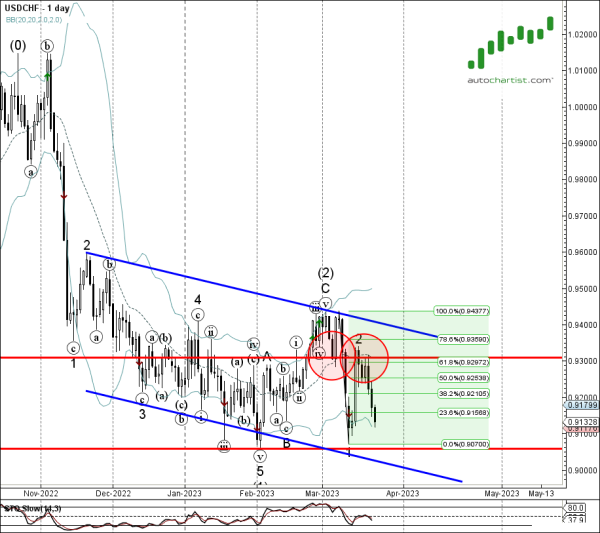
As can be seen from the daily USD/CHF chart below – the pair earlier reversed down from the resistance area located between the key resistance level 0.9300 (former support from the start of March), 20-day moving average and the 61.8% Fibonacci correction of the previous downward impulse from the start of March. The proximity of this resistance area and the clear daily downtrend add to the probability USD/CHF will continue to fall inside this Falling Wedge.