Trade of the Day: NZD/USD
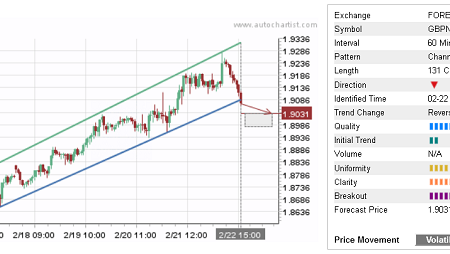
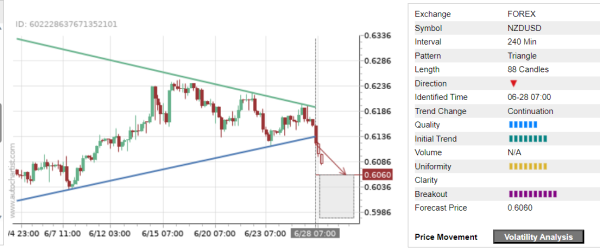
NZD/USD recently broke the 4-hour Triangle chart pattern, which was recently identified by Autochartist. Autochartist rates the quality of this Triangle at the 6-bar level – which is the result of the strong Initial Trend and Uniformity (both rated at the 8 bar level). NZD/USD is expected to fall further toward the forecast price 0.6060.
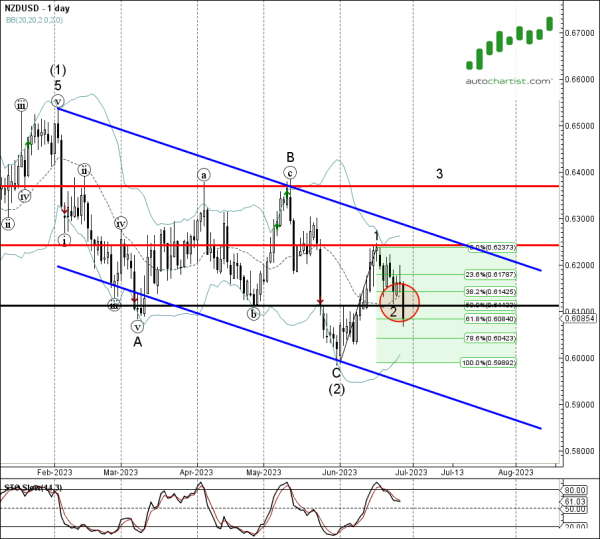
As can be seen from the daily NZD/USD chart below – the pair earlier broke the support level 0.6110, intersecting with the 50% Fibonacci correction of the upward impulse from May. Both of these price levels are acting now as the resistance levels after they were broken. The proximity of these resistance levels and the clear daily downtrend increase the probability NZD/USD will continue to fall toward the forecast price 0.6060.