Trade of the Day: NZD/USD
By: Dima Chernovolov
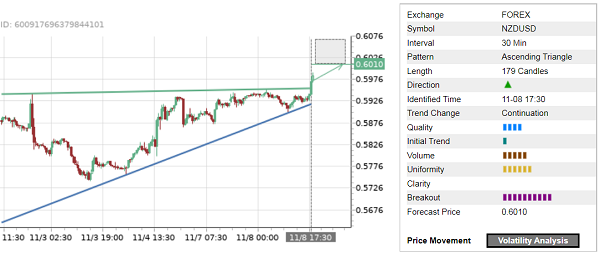
NZD/USD recently broke the 30-minute Ascending Triangle chart pattern, which was previously identified by Autochartist. Autochartist rates the quality of this Ascending Triangle at the 4-bar level – which is the result of the slow Initial Trend (1 bar), medium Uniformity (5 bars). NZD/USD is expected to rise toward the forecast price 0.6010.
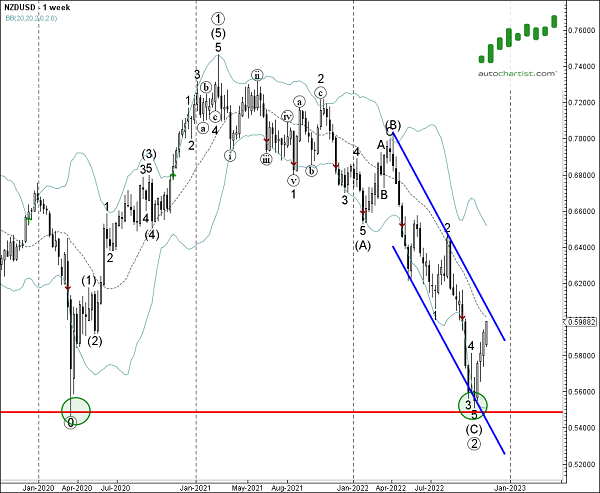
As can be seen from the weekly NZD/USD chart below – the pair earlier reversed up sharply from the major long-term support level 0.5485 (which also earlier stopped the sharp downtrend at the start of 2020) and the lower daily Bollinger Band. The proximity of this support area adds to the probability NZD/USD will continue rise toward the forecast price 0.6010.