Trade of the Day: NZD/USD
By: Dima Chernovolov
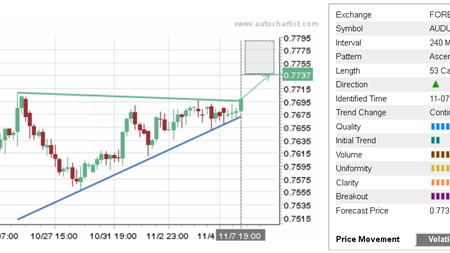
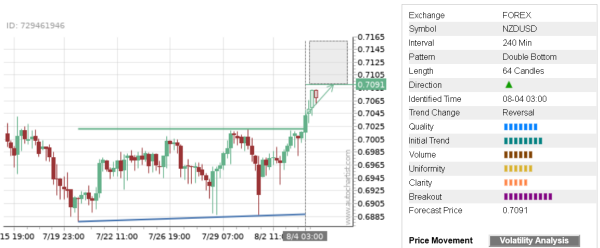
NZD/USD continues recently broke the 4-hour Double Bottom chart pattern, which was previously identified by Autochartist. Autochartist rates the quality of this Double Bottom at the 7-bar level – which is the result of the sharp Initial Trend (8 bars), above-average Uniformity (6 bars) and medium clarity (5 bars). NZD/USD is expected to rise toward the forecast price 0,7091.
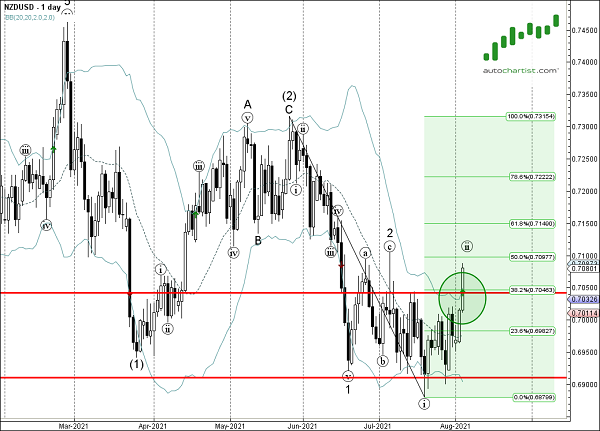
As can be seen from the daily NZD/USD chart below – the pair earlier broke the resistance area located between the key resistance level 0.7040 (which has been reversing the pair from the start of July) and the 38,2% Fibonacci correction of the downward impulse from May. This price area is acting as the support zone after it was broken. The proximity of this support zone adds to the probability NZD/USD will continue rise toward the forecast price 0,7091.