Trade of the Day: NZD/USD
By: Dima Chernovolov
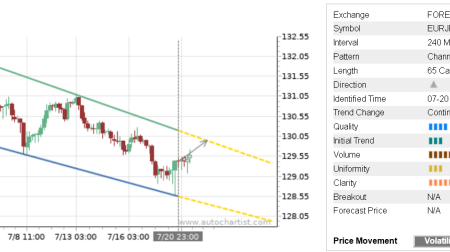
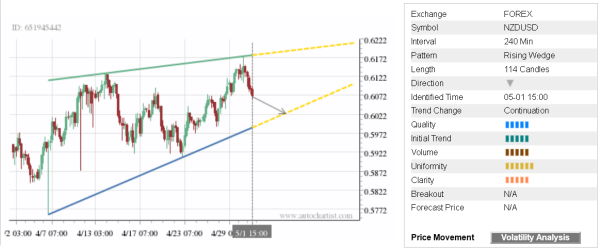
NZD/USD continues to fall inside the 4-hour Rising Wedge chart pattern which was previously identified by Autochartist. Autochartist rates the quality of this Rising Wedge at the 5-bar level – which is the result of the medium Initial Trend (5 bars), above-average Uniformity (6 bars) and medium Clarity (5 bars). NZD/USD is expected to fall further inside this chart pattern – in line with the earlier downward reversal from the resistance area shown below.
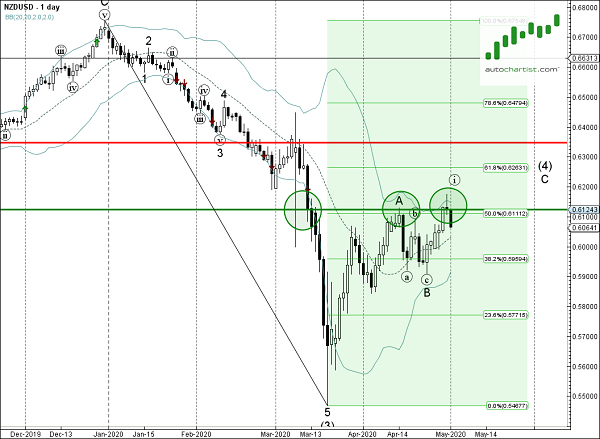
As can be seen from the daily NZD/USD chart below – the pair recently reversed down from the from the resistance area lying between the pivotal resistance level 0.6120 (which has been reversing the price from the start of April), upper daily Bollinger Band and the 50% Fibonacci correction of the earlier downward impulse from January. The proximity of this resistance area increases the probability NZD/USD will continue to fall inside this Rising Wedge.