Trade of the Day: NZD/CHF
By: Dima Chernovolov
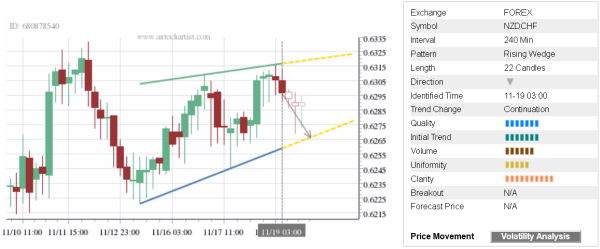
NZD/CHF continues to fall inside 4-hour Rising Wedge chart pattern, which was previously identified by Autochartist. Autochartist measures the quality of this Rising Wedge at the 7-bar level – which is the result of the significant Initial Trend (7 bars), average Uniformity (5 bars) and maximum Clarity (10 bars). NZD/CHF is expected to fall further inside this Rising Wedge – in accordance with the earlier downward reversal from the resistance area shown below.
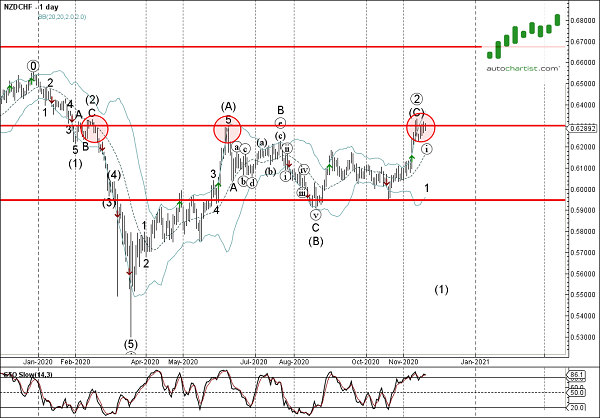
As can be seen from the daily NZD/CHF chart below, the pair earlier reversed down from the resistance area located between the long-term resistance level 0.6300 (which has been reversing the pair from February) and the upper daily Bollinger Band. The overbought daily Stochastic and the proximity to this resistance area increases the probability NZD/CHF will continue to fall inside this 4-hour Rising Wedge.