Trade of the Day: NZD/CAD
By: Dima Chernovolov
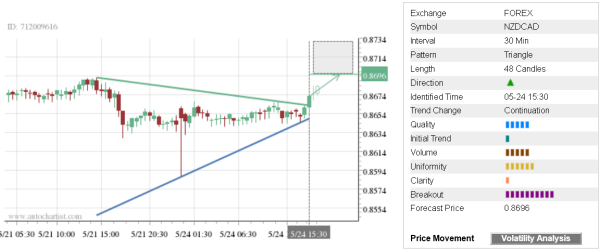
NZD/CAD recently broke the 30-minute Triangle chart pattern which was previously identified by Autochartist. Autochartist rates the quality of Triangle at the 5-bar level – which is the result of the slow Initial Trend (1 bar), higher Clarity (6 bars) and low Uniformity (1 bar). NZD/CAD is expected to rise toward the forecast price 0.8696.
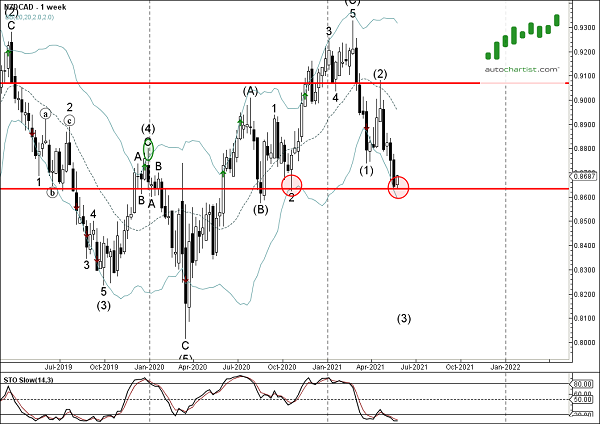
As can be seen from the daily NZD/CAD chart below – the pair earlier reversed up from the long-term support level 0.8634 (former multi-month low from October) intersecting with the lower weekly Bollinger Band. The proximity of the support level 0.8634 and the oversold weekly Stochastic increase the probability NZD/CAD will continue to rise toward the forecast price 0.8696.