Trade of the Day: GBP/USD
By: Dima Chernovolov
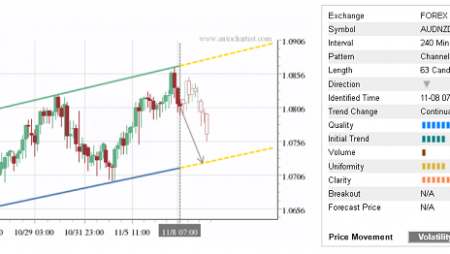
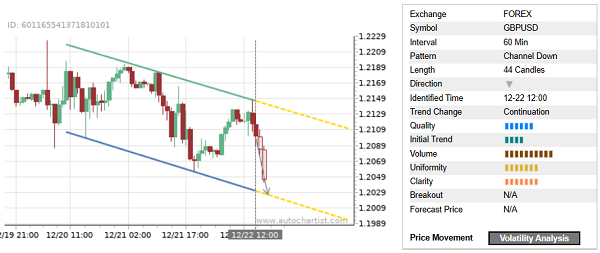
GBP/USD continues to fall inside the hourly Down Channel chart pattern, which was recently identified by Autochartist. Autochartist measures the quality of this Down Channel at the 6-bar level – which is the result of the below-average Initial Trend (4 bars) and strong Uniformity and Clarity (7 bars). GBP/USD is expected to fall further inside this Down Channel.
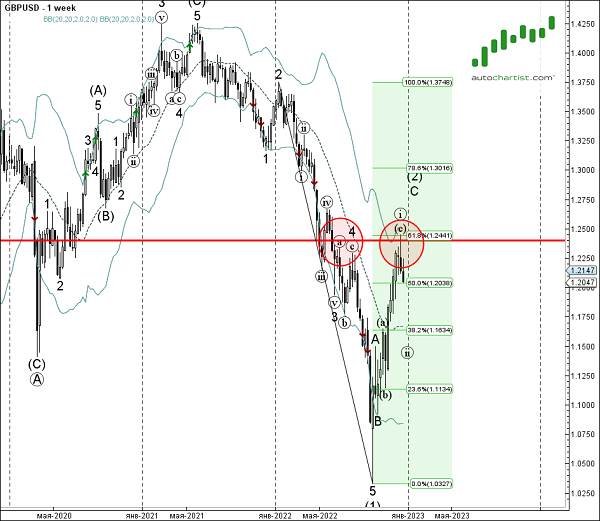
As can be seen from the weekly GBP/USD chart below – the pair earlier reversed down from the resistance area located between the long-term resistance level 1.24000 (which has been reversing the price from June), upper weekly Bollinger Band and the 61.8% Fibonacci correction of the downward impulse from the start of January. The proximity of this resistance area adds to the probability GBP/USD will continue to fall inside this Down Channel.