Trade of the Day: GBP/NZD
By: Dima Chernovolov
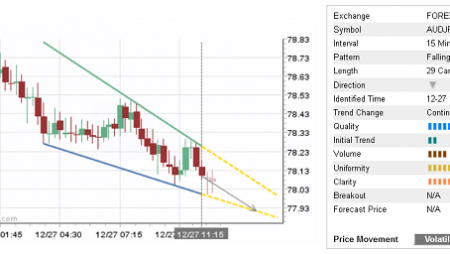
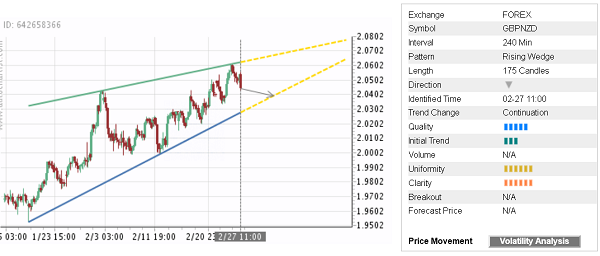
GBP/NZD continues to fall inside the 4-hour Rising Wedge chart pattern which was previously identified by Autochartist. Autochartist rates the quality of this Rising Wedge at the 5-bar level – which reflects the slow Initial Trend (3 bars), significant Uniformity and Clarity (7 bars). GBP/NZD expected to fall further inside this Rising Wedge – in line with the earlier downer reversal from the major resistance area shown below.
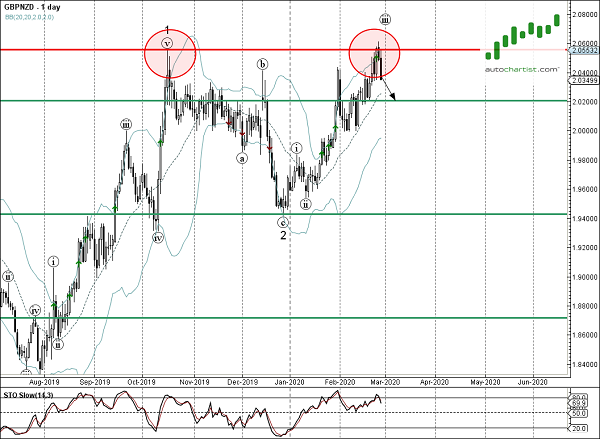
As can be seen from the daily GBP/NZD chart below – the top of this Rising Wedge formed when the price reversed down from the resistance area lying between the long-term resistance level 2.0555 (which stopped the sharp uptrend in October) and the upper daily Bollinger Band. The proximity of this resistance area adds to the probability GBP/NZD will continue to fall inside this Rising Wedge.