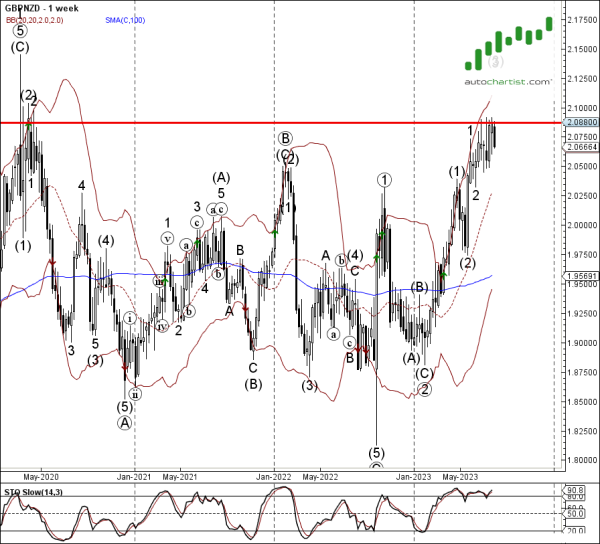
Trade of the Day: GBP/NZD
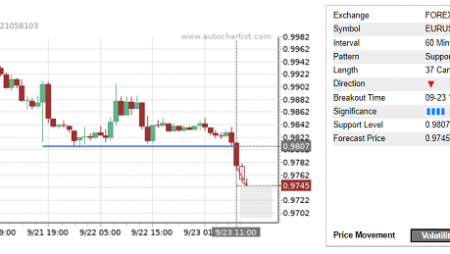
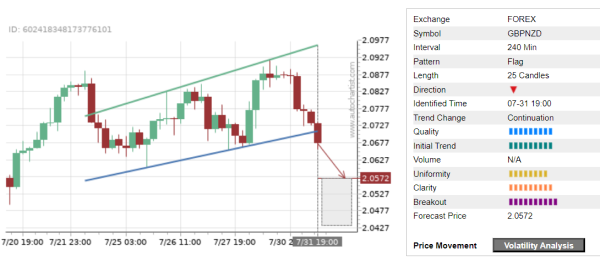
GBP/NZD recently broke the 4-hour Flag chart pattern, which was recently identified by Autochartist. Autochartist rates the quality of this Flag at the 9-bar level – which is the result of the strong Initial Trend (9 bars), substantial Uniformity (8 bars) near-maximum strong Clarity (9 bars). GBP/NZD is expected to fall toward the forecast price 2.0572.
As can be seen from the weekly GBP/NZD chart below – the pair earlier reversed down sharply from the resistance area located between the long-term resistance level 2.0870 (which reversed the pair in 2020) and the lower weekly Bollinger Band. The proximity of this resistance zone and the overbought weekly Stochastic increase the probability GBP/NZD will continue to fall toward the forecast price 2.0572.