Trade of the Day: GBP/JPY
GBP/JPY recently broke the 30-minute support level 180.41, which was identified by Autochartist. This chart pattern indicates possible bearish price movement toward the target level 178.91. The following are the optimal entry and stop-loss levels calculated by Autochartist: entry 180.19 with the protective stop-loss at 180.82.
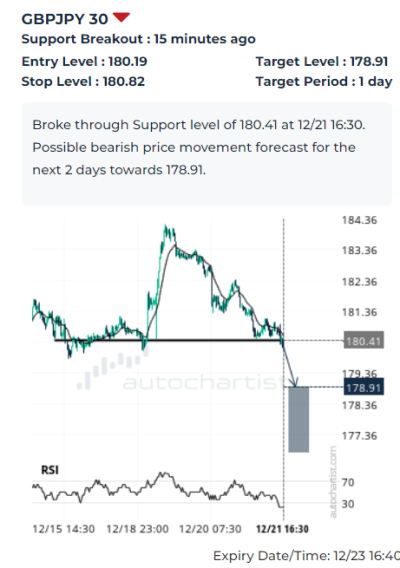
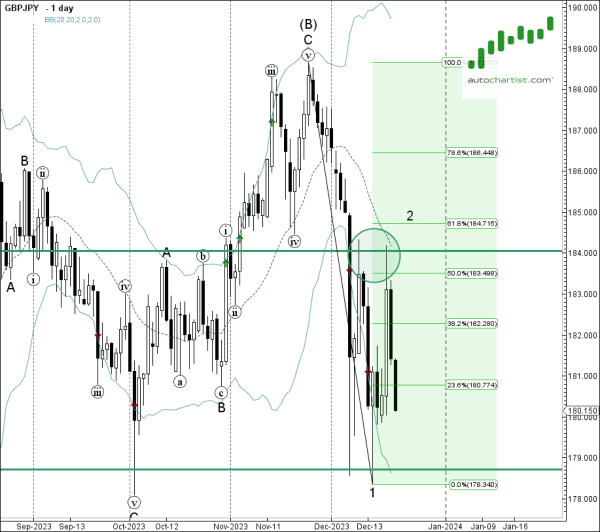
As can be seen from the daily GBP/JPY chart below – the pair earlier reversed down from the resistance area located between the key resistance level 184.00 (which stopped the previous sharp upward correction at the start of December), 20-day moving average and the 50% Fibonacci correction of the downward impulse from November. Given the proximity of these resistance levels, GBP/JPY can be expected to fall toward the target level 178.91.