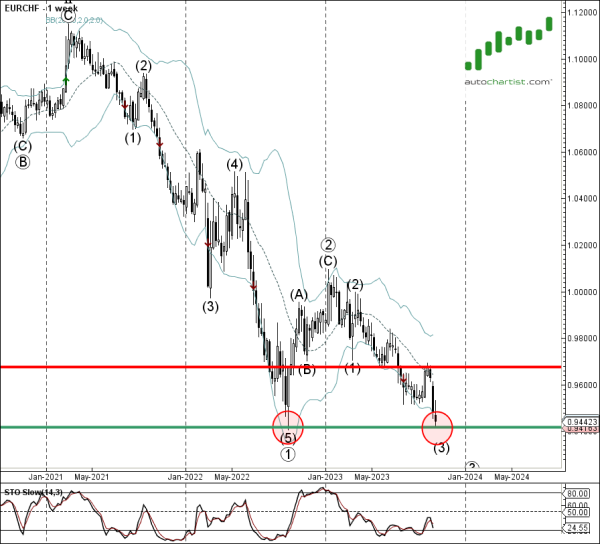
Trade of the Day: EUR/CHF
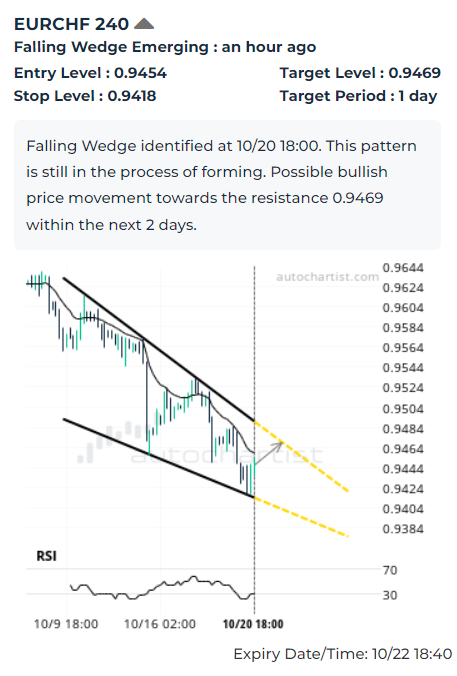
EUR/CHF continues to rise inside the 4-hour Falling Wedge chart pattern, which was recently identified by Autochartist. The chart pattern indicates possible bullish price movement toward the target level 0.9469. The following are the optimal entry and stop-loss levels calculated by Autochartist: entry at 0.9454 with the protective stop-loss at 0.9418. Rising RSI indicator confirms this bullish chart pattern.
As can be seen from the weekly EUR/CHF chart below – the pair earlier reversed up from the powerful long-term support level 0.9415 (which stopped the sharp weekly downtrend in 2022) standing near the lower weekly Bollinger Band. The proximity of this support level the clear bullish divergence on the weekly Stochastic indicator increase the probability EUR/CHF will continue to rise toward the target level 0.9469.