Trade of the Day: EUR/CHF
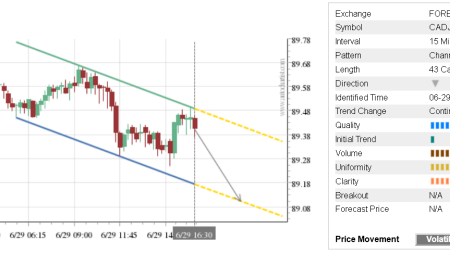
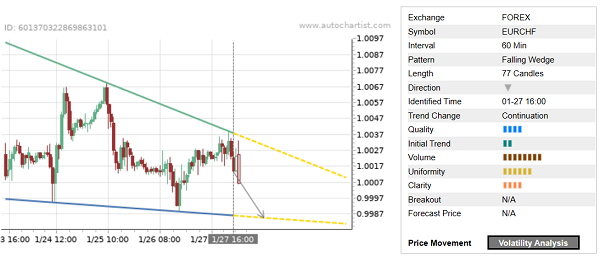
EUR/CHF continues to fall inside the 30-minute Falling Wedge chart pattern, which was recently identified by Autochartist. Autochartist rates the quality of this Falling Wedge at the 4-bar level – which is the result of the slow Initial Trend (2 bars), stronger Uniformity (6 bars) and below-average Clarity (4 bars). EUR/CHF is expected to fall further inside this Falling Wedge.
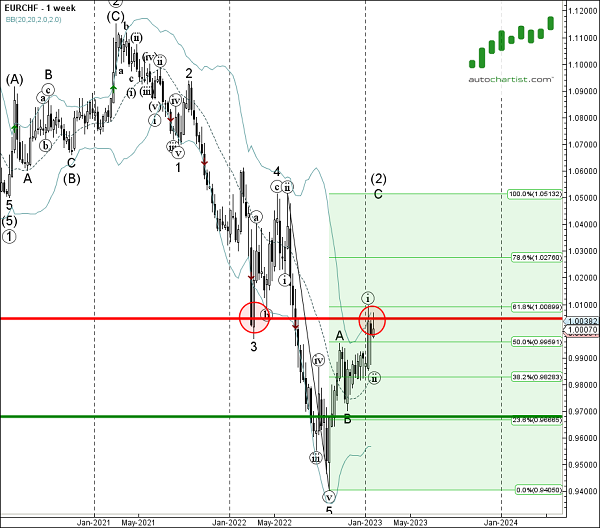
As can be seen from the weekly EUR/CHF chart below – the pair earlier reversed down from the combined resistance zone located between the major resistance level 1.0046 (which stopped the weekly downtrend at the start of 2022), intersecting with the upper weekly Bollinger Band and the 61.8% Fibonacci correction of the downward impulse from the middle of May. The proximity of his resistance area and the strong long-term downtrend increase the probability EUR/CHF will continue to fall inside this Falling Wedge.