Trade of the Day: CAD/JPY
By: Dima Chernovolov
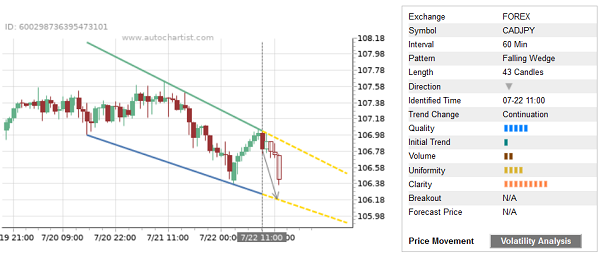
CAD/JPY continues to fall inside the hourly Falling Wedge chart pattern, which was recently identified by Autochartist. Autochartist rates the quality of this Falling Wedge at the 5-bar level – which reflects the slow Initial Trend (1 bar), below-average Uniformity (4 bars) and near-maximum Clarity (9 bars). CAD/JPY is expected to fall further inside this Falling Wedge.
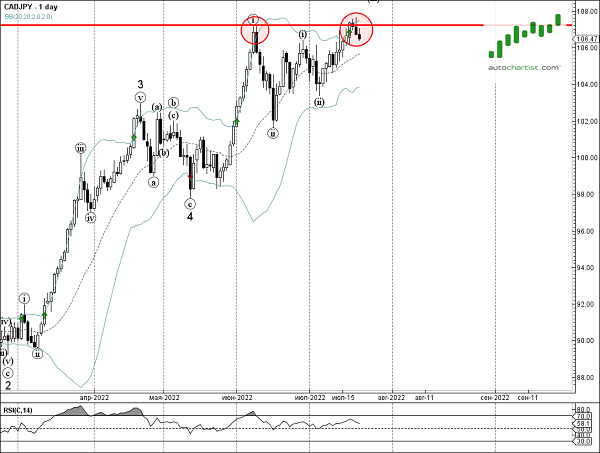
As can be seen from the daily CAD/JPY chart below – the pair previously reversed down from the resistance area located between the resistance level 107.20 (former monthly high from June) and the upper daily Bollinger Band. The proximity of this resistance area adds to the probability CAD/JPY will continue to fall inside this Falling Wedge.