Trade of the Day: CAD/JPY
By: Dima Chernovolov
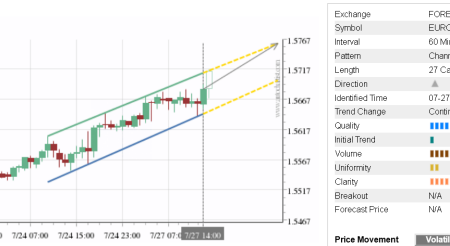
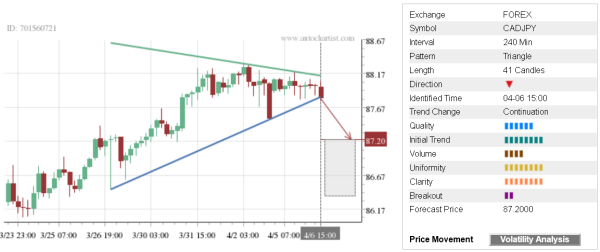
CAD/JPY recently broke the 4-hour Triangle chart pattern which was previously identified by Autochartist. Autochartist rates the quality of Triangle at the 6-bar level – which is the result of the strong Initial Trend (8 bars) and significantly Clarity and Uniformity (8 bars). CAD/JPY is expected to fall toward the forecast price 87.2 – in line with the earlier upward reversal from the resistance area shown below.
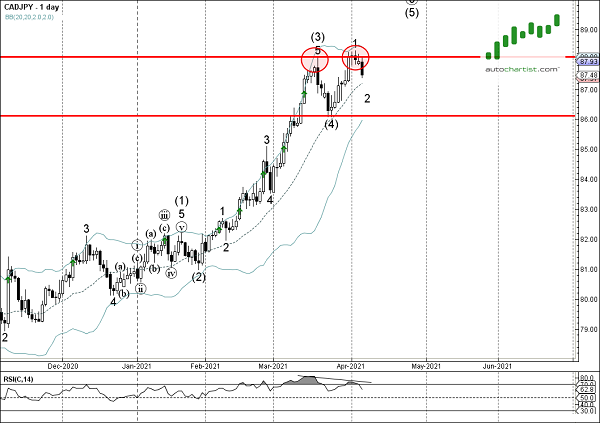
As can be seen from the daily CAD/JPY chart below – the price earlier reversed down from the resistance area located between the key resistance level 88.0 (monthly high from March) and the upper daily Bollinger Band. The proximity of this resistance area and the clear bearish divergence on the daily RSI indicator increase the probability CAD/JPY will continue to fall toward the forecast price 87.2.