Help & Documentation
  • Home
  • Sign In
  • Contact Us
  • Home
  • Sign In
  • Contact Us

Soybeans up to 910.9000

/Futures Technical Analysis - TD/Soybeans up to 910.9000

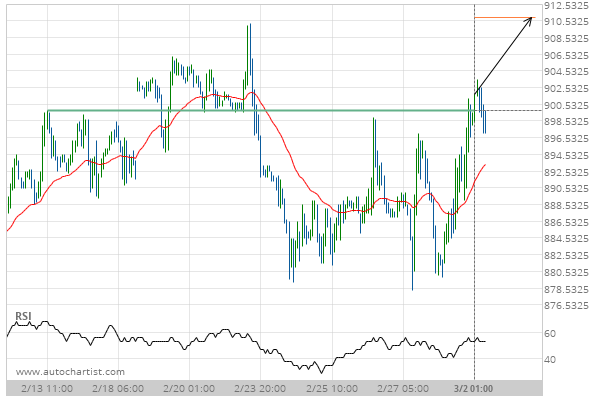
Soybeans up to 910.9000

Posted on March 2, 2020 by Autochartist wrote in Futures Technical Analysis - TD.

Broke through Resistance level of 899.7500 at 02-Mar-2020 01:00 EST

Tags: ZS
0 Likes
574 Views

You may also like

Corn up to 550.5000
Corn up to 550.5000
January 29, 2021
10 year T-Note up to 127.2961
July 17, 2019
Gold Front Month up to 1975.2000
September 14, 2020

Comments are closed.

E-mini S&P 500 down to 2952.7500 Trade of the Day: GBP/CHF

Futures Technical Analysis – TD

Light Sweet Crude Oil Front Month up to 67.9800

March 9, 2021 11:17 am | By Autochartist

Rising Wedge identified at 09-Mar-2021 05:00 EST. This pattern is... Read more →

Feeder Cattle Front Month down to 137.2250

March 9, 2021 11:17 am | By Autochartist

Channel Down identified at 08-Mar-2021 14:00 EST. This pattern is... Read more →

Soybean Oil up to 53.2300

March 9, 2021 11:17 am | By Autochartist

Channel Up identified at 09-Mar-2021 04:30 EST. This pattern is... Read more →

Silver Front Month up to 26.5600

March 9, 2021 11:17 am | By Autochartist

Approaching Resistance level of 26.5600 identified at 09-Mar-2021 04:00 EST Read more →

10 year T-Note up to 133.1644

March 9, 2021 11:17 am | By Autochartist

Falling Wedge has broken through the resistance line at 09-Mar-2021... Read more →

  • About Us
  • Privacy Policy
  • Disclaimer
  • Terms and Conditions
  • Get started for FREE
  • Contact Us
Copyright © 2022 Autochartist.com. All rights reserved.
This site uses cookies: Find out more.