Help & Documentation
  • Home
  • Sign In
  • Contact Us
  • Home
  • Sign In
  • Contact Us

Soybeans up to 851.7500

/Futures Technical Analysis - TD/Soybeans up to 851.7500

Soybeans up to 851.7500

Posted on May 3, 2019 by Autochartist wrote in Futures Technical Analysis - TD.

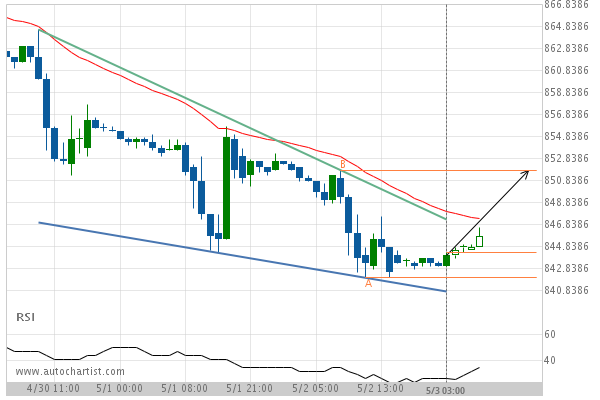
Falling Wedge identified at 03-May-2019 03:00 EDT. This pattern is still in the process of forming. Possible bullish price movement towards the resistance 851.7500 within the next 12 hours.

Tags: CBOT, ZS
0 Likes
838 Views

You may also like

Gold Front Month down to 1284.2000
May 17, 2019
Soybean Meal up to 298.0000
September 11, 2019
Lean Hogs up to 93.0250
May 31, 2019

Comments are closed.

GBP/CAD down to 1.7337 US T-Bond down to 146.8750

Futures Technical Analysis – TD

Light Sweet Crude Oil Front Month up to 67.9800

March 9, 2021 11:17 am | By Autochartist

Rising Wedge identified at 09-Mar-2021 05:00 EST. This pattern is... Read more →

Feeder Cattle Front Month down to 137.2250

March 9, 2021 11:17 am | By Autochartist

Channel Down identified at 08-Mar-2021 14:00 EST. This pattern is... Read more →

Soybean Oil up to 53.2300

March 9, 2021 11:17 am | By Autochartist

Channel Up identified at 09-Mar-2021 04:30 EST. This pattern is... Read more →

Silver Front Month up to 26.5600

March 9, 2021 11:17 am | By Autochartist

Approaching Resistance level of 26.5600 identified at 09-Mar-2021 04:00 EST Read more →

10 year T-Note up to 133.1644

March 9, 2021 11:17 am | By Autochartist

Falling Wedge has broken through the resistance line at 09-Mar-2021... Read more →

  • About Us
  • Privacy Policy
  • Disclaimer
  • Terms and Conditions
  • Get started for FREE
  • Contact Us
Copyright © 2022 Autochartist.com. All rights reserved.
This site uses cookies: Find out more.