Help & Documentation
  • Home
  • Sign In
  • Contact Us
  • Home
  • Sign In
  • Contact Us

Soybeans excessive bearish movement

/Futures Statistical Analysis - TD/Soybeans excessive bearish movement

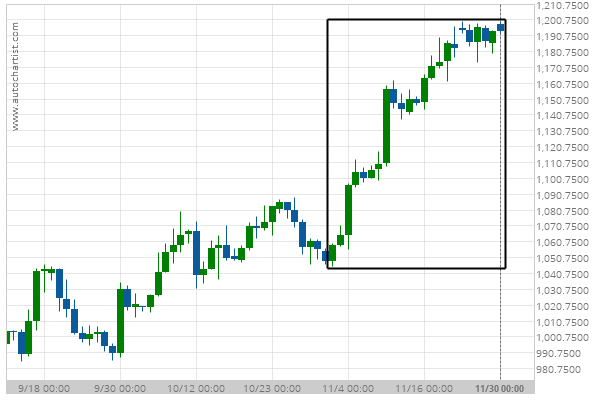
Soybeans excessive bearish movement

Posted on November 30, 2020 by Autochartist wrote in Futures Statistical Analysis - TD.

Soybeans experienced a 12.73% bullish movement in the last 28 days.

Tags: Big Movement, ZS
0 Likes
437 Views

You may also like

10 year T-Note excessive bullish movement
July 24, 2020
Soybeans excessive bearish movement
October 29, 2020
Soybean Meal excessive bearish movement
October 23, 2020

Comments are closed.

Silver Front Month excessive bearish movement NZD/USD down to 0.6998

Futures Statistical Analysis – TD

Soybean Oil excessive bearish movement

March 9, 2021 11:16 am | By Autochartist

Soybean Oil experienced a 19.04% bullish movement in the last... Read more →

Corn excessive bearish movement

March 8, 2021 11:19 am | By Autochartist

Corn experienced a 4.61% bullish movement in the last 73... Read more →

Gold Front Month excessive bearish movement

March 8, 2021 11:19 am | By Autochartist

Gold Front Month experienced a 6.29% bearish movement in the... Read more →

Light Sweet Crude Oil Front Month excessive bearish movement

March 8, 2021 11:19 am | By Autochartist

Light Sweet Crude Oil Front Month experienced a 8.6% bullish... Read more →

10 year T-Note excessive bearish movement

March 8, 2021 11:19 am | By Autochartist

10 year T-Note experienced a 3.4% bearish movement in the... Read more →

  • About Us
  • Privacy Policy
  • Disclaimer
  • Terms and Conditions
  • Get started for FREE
  • Contact Us
Copyright © 2022 Autochartist.com. All rights reserved.
This site uses cookies: Find out more.