Help & Documentation
  • Home
  • Sign In
  • Contact Us
  • Home
  • Sign In
  • Contact Us

Soybeans down to 903.7688

/Futures Technical Analysis - TD/Soybeans down to 903.7688

Soybeans down to 903.7688

Posted on February 28, 2019 by Autochartist wrote in Futures Technical Analysis - TD.

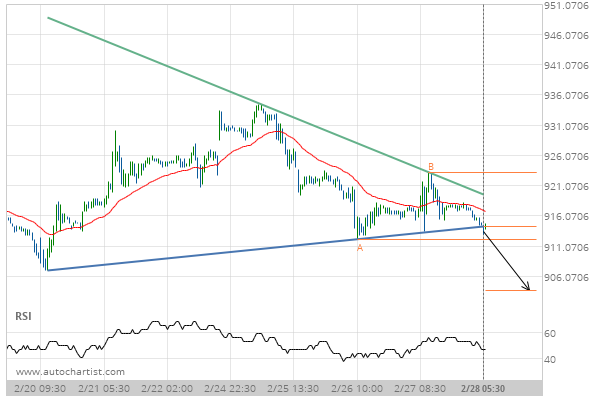
Triangle has broken through the support line at 28-Feb-2019 05:30 EST. Possible bearish price movement forecast for the next 2 days towards 903.7688.

Tags: CBOT, ZS
0 Likes
794 Views

You may also like

E-mini S&P 500 up to 3113.5000
June 16, 2020
E-mini S&P 500 down to 2819.5000
April 20, 2020
Silver Front Month up to 24.5450
October 5, 2020

Comments are closed.

Silver Front Month down to 15.6472 Soybean Oil down to 30.0700

Futures Technical Analysis – TD

Light Sweet Crude Oil Front Month up to 67.9800

March 9, 2021 11:17 am | By Autochartist

Rising Wedge identified at 09-Mar-2021 05:00 EST. This pattern is... Read more →

Feeder Cattle Front Month down to 137.2250

March 9, 2021 11:17 am | By Autochartist

Channel Down identified at 08-Mar-2021 14:00 EST. This pattern is... Read more →

Soybean Oil up to 53.2300

March 9, 2021 11:17 am | By Autochartist

Channel Up identified at 09-Mar-2021 04:30 EST. This pattern is... Read more →

Silver Front Month up to 26.5600

March 9, 2021 11:17 am | By Autochartist

Approaching Resistance level of 26.5600 identified at 09-Mar-2021 04:00 EST Read more →

10 year T-Note up to 133.1644

March 9, 2021 11:17 am | By Autochartist

Falling Wedge has broken through the resistance line at 09-Mar-2021... Read more →

  • About Us
  • Privacy Policy
  • Disclaimer
  • Terms and Conditions
  • Get started for FREE
  • Contact Us
Copyright © 2022 Autochartist.com. All rights reserved.
This site uses cookies: Find out more.