Help & Documentation
  • Home
  • Sign In
  • Contact Us
  • Home
  • Sign In
  • Contact Us

Soybean Oil up to 31.0657

/Futures Technical Analysis - TD/Soybean Oil up to 31.0657

Soybean Oil up to 31.0657

Posted on October 16, 2019 by Autochartist wrote in Futures Technical Analysis - TD.

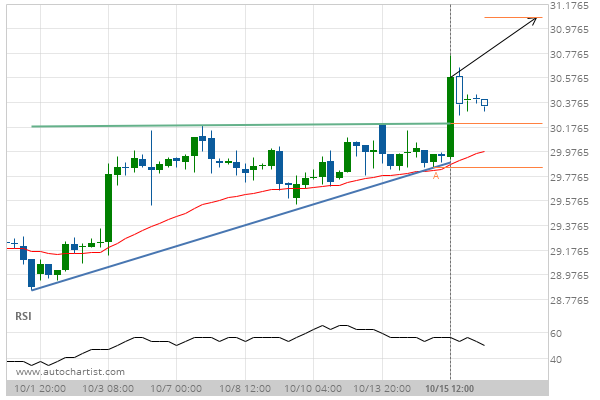
Ascending Triangle has broken through the resistance line at 15-Oct-2019 12:00 EDT. Possible bullish price movement forecast for the next 2 days towards 31.0657.

Tags: CBOT, ZL
0 Likes
810 Views

You may also like

Soybean Meal down to 282.0000
May 26, 2020
Gold Front Month up to 1292.1195
May 30, 2019
Soybeans down to 884.2500
July 30, 2019

Comments are closed.

AUD/USD up to 0.6789 Silver Front Month down to 17.0152

Futures Technical Analysis – TD

Light Sweet Crude Oil Front Month up to 67.9800

March 9, 2021 11:17 am | By Autochartist

Rising Wedge identified at 09-Mar-2021 05:00 EST. This pattern is... Read more →

Feeder Cattle Front Month down to 137.2250

March 9, 2021 11:17 am | By Autochartist

Channel Down identified at 08-Mar-2021 14:00 EST. This pattern is... Read more →

Soybean Oil up to 53.2300

March 9, 2021 11:17 am | By Autochartist

Channel Up identified at 09-Mar-2021 04:30 EST. This pattern is... Read more →

Silver Front Month up to 26.5600

March 9, 2021 11:17 am | By Autochartist

Approaching Resistance level of 26.5600 identified at 09-Mar-2021 04:00 EST Read more →

10 year T-Note up to 133.1644

March 9, 2021 11:17 am | By Autochartist

Falling Wedge has broken through the resistance line at 09-Mar-2021... Read more →

  • About Us
  • Privacy Policy
  • Disclaimer
  • Terms and Conditions
  • Get started for FREE
  • Contact Us
Copyright © 2022 Autochartist.com. All rights reserved.
This site uses cookies: Find out more.