Help & Documentation
  • Home
  • Sign In
  • Contact Us
  • Home
  • Sign In
  • Contact Us

Soybean Oil excessive bearish movement

/Futures Statistical Analysis - TD/Soybean Oil excessive bearish movement

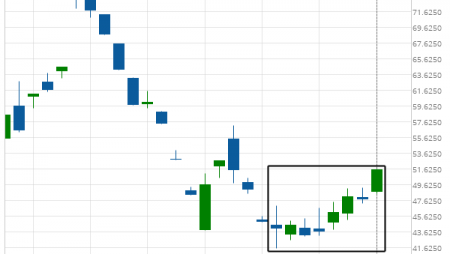
Soybean Oil excessive bearish movement

Posted on February 1, 2019 by Autochartist wrote in Futures Statistical Analysis - TD.

Soybean Oil experienced a 4.19% bullish movement in the last 9 days.

Tags: Big Movement, ZL
0 Likes
963 Views

You may also like

Silver Front Month excessive bearish movement
July 25, 2019
Corn excessive bearish movement
June 3, 2019
Lean Hogs excessive bearish movement
November 20, 2018

Comments are closed.

General Electric Co. (GE) excessive bearish movement Daily Forex Update: GBP/CAD

Futures Statistical Analysis – TD

Soybean Oil excessive bearish movement

March 9, 2021 11:16 am | By Autochartist

Soybean Oil experienced a 19.04% bullish movement in the last... Read more →

Corn excessive bearish movement

March 8, 2021 11:19 am | By Autochartist

Corn experienced a 4.61% bullish movement in the last 73... Read more →

Gold Front Month excessive bearish movement

March 8, 2021 11:19 am | By Autochartist

Gold Front Month experienced a 6.29% bearish movement in the... Read more →

Light Sweet Crude Oil Front Month excessive bearish movement

March 8, 2021 11:19 am | By Autochartist

Light Sweet Crude Oil Front Month experienced a 8.6% bullish... Read more →

US T-Bond excessive bearish movement

March 8, 2021 11:19 am | By Autochartist

US T-Bond experienced a 7.75% bearish movement in the last... Read more →

  • About Us
  • Privacy Policy
  • Disclaimer
  • Terms and Conditions
  • Get started for FREE
  • Contact Us
Copyright © 2022 Autochartist.com. All rights reserved.
This site uses cookies: Find out more.