Help & Documentation
  • Home
  • Sign In
  • Contact Us
  • Home
  • Sign In
  • Contact Us

Soybean Oil down to 43.3300

/Futures Technical Analysis - TD/Soybean Oil down to 43.3300

Soybean Oil down to 43.3300

Posted on February 12, 2021 by admin wrote in Futures Technical Analysis - TD.

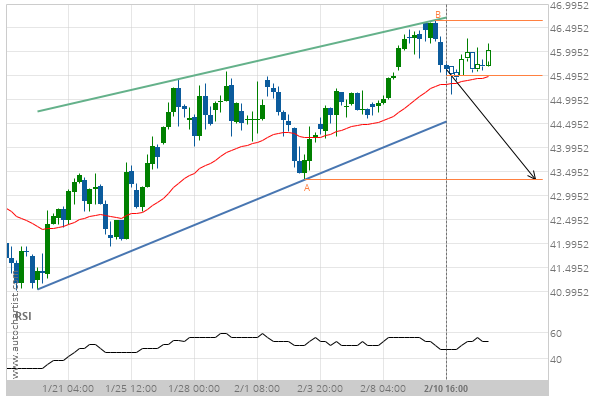
Rising Wedge identified at 10-Feb-2021 16:00 EST. This pattern is still in the process of forming. Possible bearish price movement towards the support 43.3300 within the next 3 days.

Tags: CBOT, ZL
0 Likes
32 Views

You may also like

Gold Front Month down to 1627.2087
March 25, 2020
Soybean Oil up to 30.6400
March 8, 2019
US T-Bond up to 174.5938
October 28, 2020

Comments are closed.

KC HRW Wheat up to 644.0000 Microsoft Corporation (MSFT) excessive bearish movement

Futures Technical Analysis – TD

KC HRW Wheat down to 643.2500

February 26, 2021 11:15 am | By admin

Channel Down identified at 26-Feb-2021 04:00 EST. This pattern is... Read more →

Soybean Oil down to 49.0700

February 26, 2021 11:15 am | By admin

Falling Wedge identified at 26-Feb-2021 05:30 EST. This pattern is... Read more →

Soybeans down to 1365.0000

February 26, 2021 11:15 am | By admin

Approaching Support level of 1365.0000 identified at 25-Feb-2021 21:00 EST Read more →

Silver Front Month down to 26.5090

February 26, 2021 11:15 am | By admin

Broke through Support level of 27.2200 at 26-Feb-2021 01:00 EST Read more →

Light Sweet Crude Oil Front Month up to 63.6700

February 26, 2021 11:15 am | By admin

Rising Wedge identified at 26-Feb-2021 06:00 EST. This pattern is... Read more →

  • About Us
  • Privacy Policy
  • Disclaimer
  • Terms and Conditions
  • Get started for FREE
  • Contact Us
Copyright © 2020 Autochartist.com. All rights reserved.
This site uses cookies: Find out more.