Help & Documentation
  • Home
  • Sign In
  • Contact Us
  • Home
  • Sign In
  • Contact Us

Silver Front Month up to 16.6312

/Futures Technical Analysis - TD/Silver Front Month up to 16.6312

Silver Front Month up to 16.6312

Posted on July 23, 2019 by admin wrote in Futures Technical Analysis - TD.

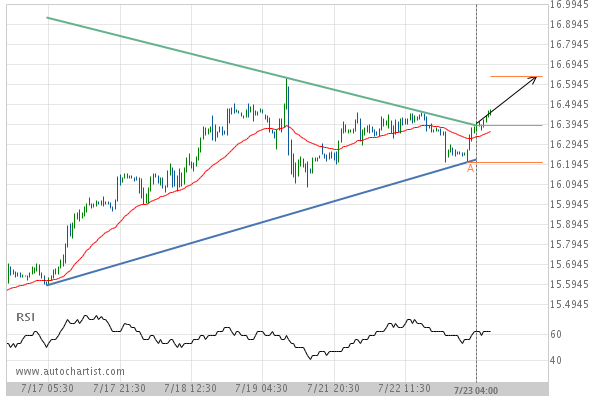
Triangle has broken through the resistance line at 23-Jul-2019 04:00 EDT. Possible bullish price movement forecast for the next day towards 16.6312.

Tags: COMEX, SI
0 Likes
339 Views

You may also like

US T-Bond up to 182.8125
July 31, 2020
Lean Hogs up to 57.0729
February 27, 2019
Soybeans up to 877.7500
September 4, 2019

Comments are closed.

Gold Front Month down to 1387.5000 3m Co. (MMM) up to 177.25

Futures Technical Analysis – TD

Soybeans up to 1410.0000

January 20, 2021 11:17 am | By admin

Channel Down identified at 20-Jan-2021 06:00 EST. This pattern is... Read more →

Corn up to 524.0000

January 20, 2021 11:17 am | By admin

Falling Wedge identified at 20-Jan-2021 06:00 EST. This pattern is... Read more →

Gold Front Month down to 1838.7000

January 20, 2021 11:17 am | By admin

Rising Wedge identified at 20-Jan-2021 06:00 EST. This pattern is... Read more →

Lean Hogs down to 65.7250

January 20, 2021 11:17 am | By admin

Approaching Support level of 65.7250 identified at 19-Jan-2021 16:00 EST Read more →

KC HRW Wheat down to 647.5000

January 19, 2021 11:18 am | By admin

Triangle identified at 19-Jan-2021 06:00 EST. This pattern is still... Read more →

  • About Us
  • Privacy Policy
  • Disclaimer
  • Terms and Conditions
  • Get started for FREE
  • Contact Us
Copyright © 2020 Autochartist.com. All rights reserved.
This site uses cookies: Find out more.