Help & Documentation
  • Home
  • Sign In
  • Contact Us
  • Home
  • Sign In
  • Contact Us

Pfizer Inc. (PFE) down to 41.03

/US Stocks Technical Analysis - TD/Pfizer Inc. (PFE) down to 41.03

Pfizer Inc. (PFE) down to 41.03

Posted on February 14, 2019 by Autochartist wrote in US Stocks Technical Analysis - TD.

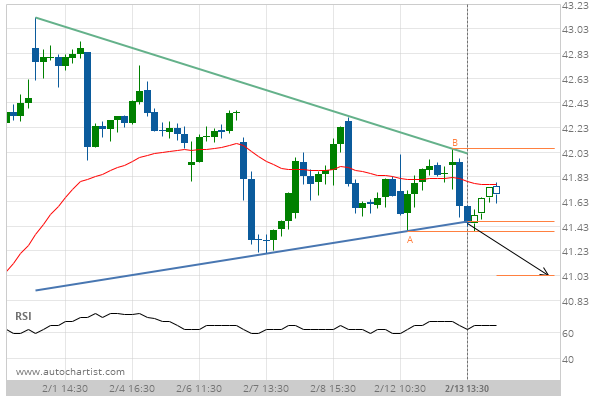
Triangle has broken through the support line at 13-Feb-2019 13:30 EST. Possible bearish price movement forecast for the next 15 hours towards 41.03.

Tags: NYSE, PFE, Pfizer Inc.
0 Likes
750 Views

You may also like

Home Depot Inc. (HD) up to 246.00
February 20, 2020
Coca-Cola Co. (KO) up to 46.69
October 10, 2018
3m Co. (MMM) up to 150.64
April 24, 2020

Comments are closed.

Johnson & Johnson (JNJ) up to 135.19 Nike Inc. Cl B (NKE) up to 85.55

US Stocks Technical Analysis – TD

Merck & Co. Inc. (MRK) up to 75.56

March 9, 2021 11:13 am | By Autochartist

Rising Wedge identified at 08-Mar-2021 19:30 EST. This pattern is... Read more →

Jpmorgan Chase & Co. (JPM) down to 147.97

March 9, 2021 11:13 am | By Autochartist

Channel Up identified at 08-Mar-2021 19:00 EST. This pattern is... Read more →

Visa (V) down to 215.41

March 9, 2021 11:13 am | By Autochartist

Triangle identified at 08-Mar-2021 20:00 EST. This pattern is still... Read more →

Home Depot Inc. (HD) down to 247.10

March 9, 2021 11:13 am | By Autochartist

Channel Down identified at 08-Mar-2021 16:00 EST. This pattern is... Read more →

Intel Corporation () down to 58.10

March 9, 2021 11:13 am | By Autochartist

Approaching Support level of 58.10 identified at 08-Mar-2021 16:00 EST Read more →

  • About Us
  • Privacy Policy
  • Disclaimer
  • Terms and Conditions
  • Get started for FREE
  • Contact Us
Copyright © 2022 Autochartist.com. All rights reserved.
This site uses cookies: Find out more.