Help & Documentation
  • Home
  • Sign In
  • Contact Us
  • Home
  • Sign In
  • Contact Us

NZD/JPY up to 72.4280

/Forex Technical Analysis - TD/NZD/JPY up to 72.4280

NZD/JPY up to 72.4280

Posted on July 2, 2019 by Autochartist wrote in Forex Technical Analysis - TD.

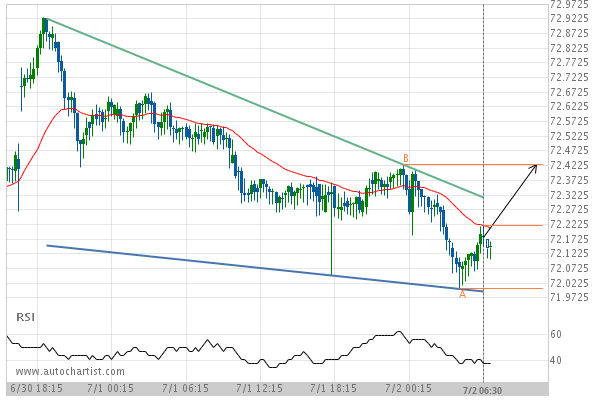
Falling Wedge identified at 02-Jul-2019 06:30 EDT. This pattern is still in the process of forming. Possible bullish price movement towards the resistance 72.4280 within the next 11 hours.

Tags: NZDJPY
0 Likes
574 Views

You may also like

NZD/USD down to 0.6726
February 8, 2019
USD/CHF down to 0.9663
May 13, 2020
GBP/NZD up to 1.9600
June 19, 2020

Comments are closed.

CAD/JPY up to 82.6660 CAD/CHF up to 0.7535

Forex Technical Analysis – TD

EUR/CHF up to 1.1152

March 9, 2021 11:15 am | By Autochartist

Rising Wedge identified at 09-Mar-2021 00:00 EST. This pattern is... Read more →

EUR/JPY up to 129.6360

March 9, 2021 11:15 am | By Autochartist

Triangle identified at 08-Mar-2021 20:00 EST. This pattern is still... Read more →

NZD/USD up to 0.7188

March 9, 2021 11:15 am | By Autochartist

Broke through Resistance level of 0.7153 at 09-Mar-2021 04:00 EST Read more →

USD/JPY down to 108.1606

March 9, 2021 11:15 am | By Autochartist

Rising Wedge has broken through the support line at 09-Mar-2021... Read more →

USD/CHF down to 0.9284

March 9, 2021 11:15 am | By Autochartist

Approaching Support level of 0.9284 identified at 09-Mar-2021 05:15 EST Read more →

  • About Us
  • Privacy Policy
  • Disclaimer
  • Terms and Conditions
  • Get started for FREE
  • Contact Us
Copyright © 2020 Autochartist.com. All rights reserved.
This site uses cookies: Find out more.