Nike Inc. Cl B (NKE) up to 86.16
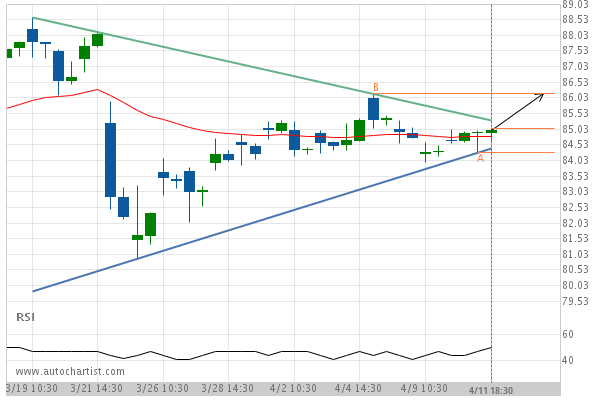
Triangle identified at 11-Apr-2019 18:30 EDT. This pattern is still in the process of forming. Possible bullish price movement towards the resistance 86.16 within the next 2 days.
Triangle identified at 11-Apr-2019 18:30 EDT. This pattern is still in the process of forming. Possible bullish price movement towards the resistance 86.16 within the next 2 days.