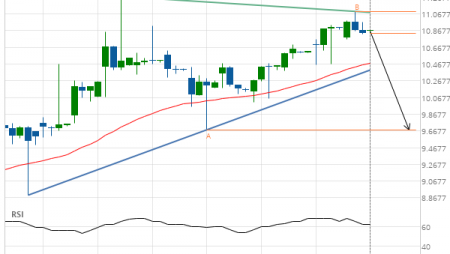
Nike Inc. Cl B (NKE) down to 100.19
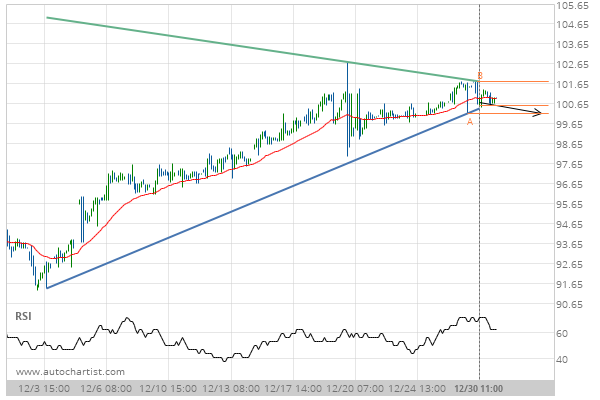
Triangle identified at 30-Dec-2019 11:00 EST. This pattern is still in the process of forming. Possible bearish price movement towards the support 100.19 within the next 3 days.
Triangle identified at 30-Dec-2019 11:00 EST. This pattern is still in the process of forming. Possible bearish price movement towards the support 100.19 within the next 3 days.