Microsoft Corporation (MSFT) up to 137.74
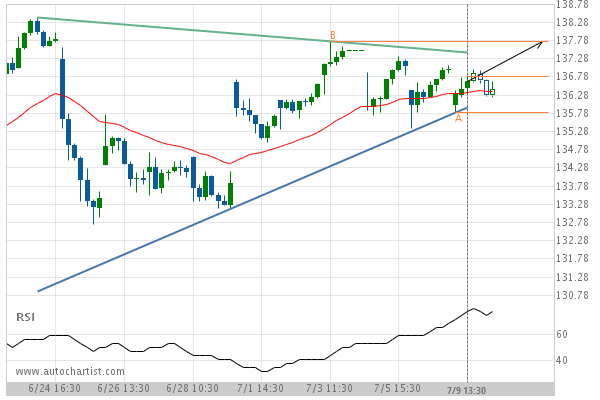
Triangle identified at 09-Jul-2019 13:30 EDT. This pattern is still in the process of forming. Possible bullish price movement towards the resistance 137.74 within the next 19 hours.
Triangle identified at 09-Jul-2019 13:30 EDT. This pattern is still in the process of forming. Possible bullish price movement towards the resistance 137.74 within the next 19 hours.