Help & Documentation
  • Home
  • Sign In
  • Contact Us
  • Home
  • Sign In
  • Contact Us

Lean Hogs up to 67.9647

/Futures Technical Analysis - TD/Lean Hogs up to 67.9647

Lean Hogs up to 67.9647

Posted on February 19, 2020 by Autochartist wrote in Futures Technical Analysis - TD.

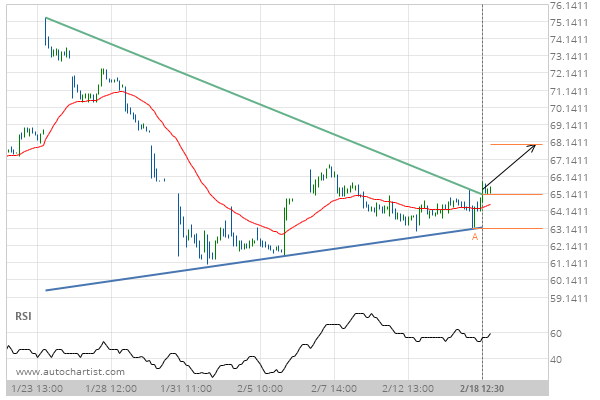
Triangle has broken through the resistance line at 18-Feb-2020 12:30 EST. Possible bullish price movement forecast for the next day towards 67.9647.

Tags: CME, HE
0 Likes
686 Views

You may also like

Gold Front Month up to 1522.3000
October 11, 2019
US T-Bond down to 154.3397
July 18, 2019
Silver Front Month down to 25.1850
December 29, 2020

Comments are closed.

Soybean Meal up to 299.6600 Chevron (CVX) excessive bearish movement

Futures Technical Analysis – TD

Light Sweet Crude Oil Front Month up to 67.9800

March 9, 2021 11:17 am | By Autochartist

Rising Wedge identified at 09-Mar-2021 05:00 EST. This pattern is... Read more →

Feeder Cattle Front Month down to 137.2250

March 9, 2021 11:17 am | By Autochartist

Channel Down identified at 08-Mar-2021 14:00 EST. This pattern is... Read more →

Soybean Oil up to 53.2300

March 9, 2021 11:17 am | By Autochartist

Channel Up identified at 09-Mar-2021 04:30 EST. This pattern is... Read more →

Silver Front Month up to 26.5600

March 9, 2021 11:17 am | By Autochartist

Approaching Resistance level of 26.5600 identified at 09-Mar-2021 04:00 EST Read more →

10 year T-Note up to 133.1644

March 9, 2021 11:17 am | By Autochartist

Falling Wedge has broken through the resistance line at 09-Mar-2021... Read more →

  • About Us
  • Privacy Policy
  • Disclaimer
  • Terms and Conditions
  • Get started for FREE
  • Contact Us
Copyright © 2022 Autochartist.com. All rights reserved.
This site uses cookies: Find out more.