Help & Documentation
  • Home
  • Sign In
  • Contact Us
  • Home
  • Sign In
  • Contact Us

Lean Hogs up to 67.0275

/Futures Technical Analysis - TD/Lean Hogs up to 67.0275

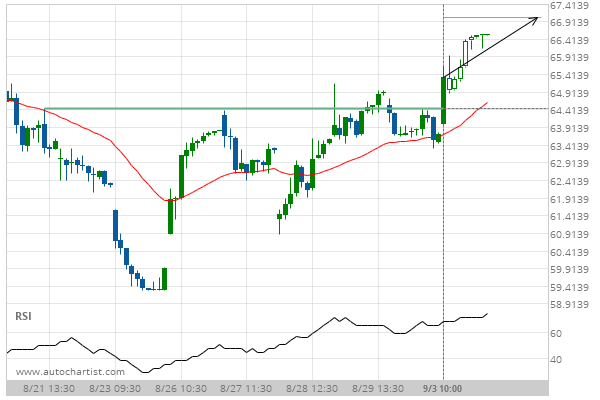
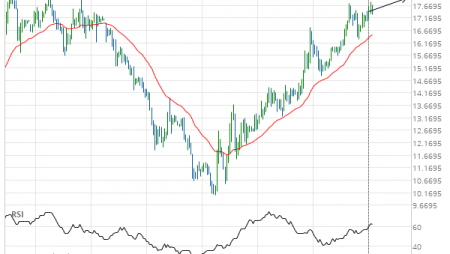
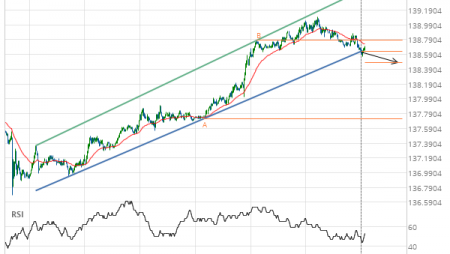
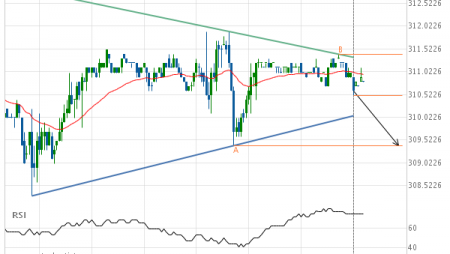
Lean Hogs up to 67.0275

Posted on September 4, 2019 by Autochartist wrote in Futures Technical Analysis - TD.

Broke through Resistance level of 64.4500 at 03-Sep-2019 10:00 EDT

Tags: HE
0 Likes
482 Views

You may also like

US T-Bond down to 173.8781
June 16, 2020
Soybean Meal down to 309.0000
June 11, 2019
Light Sweet Crude Oil Front Month down to 45.6900
December 22, 2020

Comments are closed.

Should we expect a breakout or a rebound on E-mini S&P 500 SEPTEMBER 2019? E-mini S&P 500 up to 2946.5000

Futures Technical Analysis – TD

Light Sweet Crude Oil Front Month up to 67.9800

March 9, 2021 11:17 am | By Autochartist

Rising Wedge identified at 09-Mar-2021 05:00 EST. This pattern is... Read more →

Feeder Cattle Front Month down to 137.2250

March 9, 2021 11:17 am | By Autochartist

Channel Down identified at 08-Mar-2021 14:00 EST. This pattern is... Read more →

Soybean Oil up to 53.2300

March 9, 2021 11:17 am | By Autochartist

Channel Up identified at 09-Mar-2021 04:30 EST. This pattern is... Read more →

Silver Front Month up to 26.5600

March 9, 2021 11:17 am | By Autochartist

Approaching Resistance level of 26.5600 identified at 09-Mar-2021 04:00 EST Read more →

10 year T-Note up to 133.1644

March 9, 2021 11:17 am | By Autochartist

Falling Wedge has broken through the resistance line at 09-Mar-2021... Read more →

  • About Us
  • Privacy Policy
  • Disclaimer
  • Terms and Conditions
  • Get started for FREE
  • Contact Us
Copyright © 2020 Autochartist.com. All rights reserved.
This site uses cookies: Find out more.