Help & Documentation
  • Home
  • Sign In
  • Contact Us
  • Home
  • Sign In
  • Contact Us

Lean Hogs excessive bearish movement

/Futures Statistical Analysis - TD/Lean Hogs excessive bearish movement

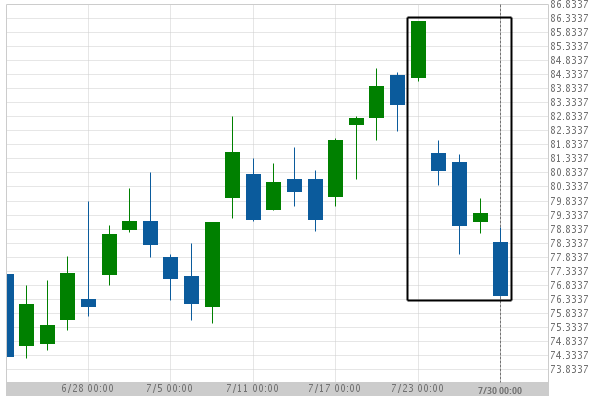
Lean Hogs excessive bearish movement

Posted on July 30, 2019 by Autochartist wrote in Futures Statistical Analysis - TD.

Lean Hogs experienced a 9.2% bearish movement in the last 7 days.

Tags: Big Movement, HE
0 Likes
776 Views

You may also like

Light Sweet Crude Oil Front Month excessive bearish movement
September 16, 2020
Gold Front Month excessive bearish movement
October 18, 2018
CORN DECEMBER 2019 excessive bearish movement
October 7, 2019

Comments are closed.

10 year T-Note down to 127.3281 Important price line breached by NZD/USD

Futures Statistical Analysis – TD

Soybean Oil excessive bearish movement

March 9, 2021 11:16 am | By Autochartist

Soybean Oil experienced a 19.04% bullish movement in the last... Read more →

Corn excessive bearish movement

March 8, 2021 11:19 am | By Autochartist

Corn experienced a 4.61% bullish movement in the last 73... Read more →

Gold Front Month excessive bearish movement

March 8, 2021 11:19 am | By Autochartist

Gold Front Month experienced a 6.29% bearish movement in the... Read more →

Light Sweet Crude Oil Front Month excessive bearish movement

March 8, 2021 11:19 am | By Autochartist

Light Sweet Crude Oil Front Month experienced a 8.6% bullish... Read more →

10 year T-Note excessive bearish movement

March 8, 2021 11:19 am | By Autochartist

10 year T-Note experienced a 3.4% bearish movement in the... Read more →

  • About Us
  • Privacy Policy
  • Disclaimer
  • Terms and Conditions
  • Get started for FREE
  • Contact Us
Copyright © 2022 Autochartist.com. All rights reserved.
This site uses cookies: Find out more.