Help & Documentation
  • Home
  • Sign In
  • Contact Us
  • Home
  • Sign In
  • Contact Us

Lean Hogs down to 62.4868

/Futures Technical Analysis - TD/Lean Hogs down to 62.4868

Lean Hogs down to 62.4868

Posted on October 30, 2020 by Autochartist wrote in Futures Technical Analysis - TD.

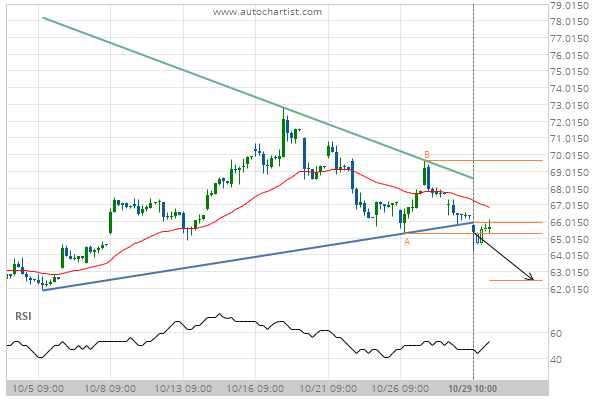
Triangle has broken through the support line at 29-Oct-2020 10:00 EDT. Possible bearish price movement forecast for the next day towards 62.4868.

Tags: CME, HE
0 Likes
297 Views

You may also like

Corn up to 569.4500
Corn up to 569.4500
February 23, 2021
Silver Front Month up to 15.9469
February 18, 2019
10 year T-Note down to 138.7500
October 7, 2020

Comments are closed.

Silver Front Month down to 22.6250 Feeder Cattle Front Month up to 129.4500

Futures Technical Analysis – TD

Light Sweet Crude Oil Front Month up to 67.9800

March 9, 2021 11:17 am | By Autochartist

Rising Wedge identified at 09-Mar-2021 05:00 EST. This pattern is... Read more →

Feeder Cattle Front Month down to 137.2250

March 9, 2021 11:17 am | By Autochartist

Channel Down identified at 08-Mar-2021 14:00 EST. This pattern is... Read more →

Soybean Oil up to 53.2300

March 9, 2021 11:17 am | By Autochartist

Channel Up identified at 09-Mar-2021 04:30 EST. This pattern is... Read more →

Silver Front Month up to 26.5600

March 9, 2021 11:17 am | By Autochartist

Approaching Resistance level of 26.5600 identified at 09-Mar-2021 04:00 EST Read more →

10 year T-Note up to 133.1644

March 9, 2021 11:17 am | By Autochartist

Falling Wedge has broken through the resistance line at 09-Mar-2021... Read more →

  • About Us
  • Privacy Policy
  • Disclaimer
  • Terms and Conditions
  • Get started for FREE
  • Contact Us
Copyright © 2020 Autochartist.com. All rights reserved.
This site uses cookies: Find out more.