Help & Documentation
  • Home
  • Sign In
  • Contact Us
  • Home
  • Sign In
  • Contact Us

Lean Hogs down to 61.1075

/Futures Technical Analysis - TD/Lean Hogs down to 61.1075

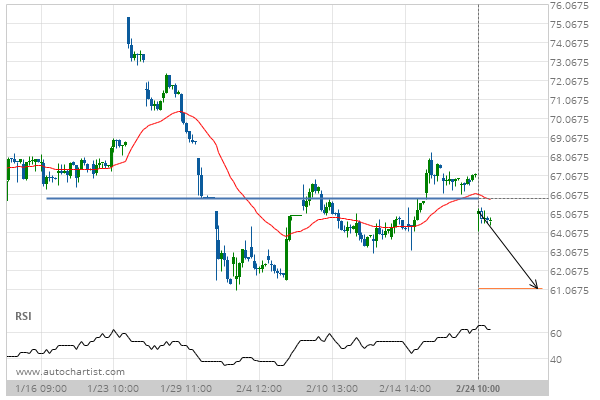
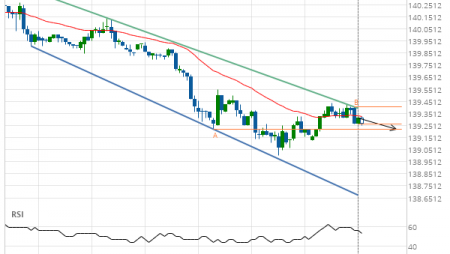
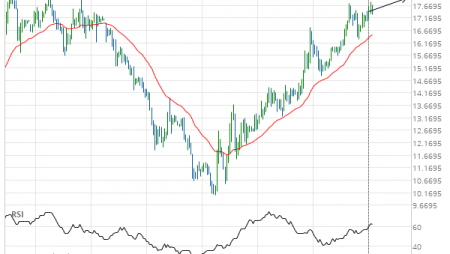
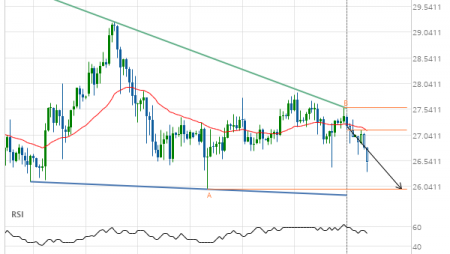
Lean Hogs down to 61.1075

Posted on February 25, 2020 by Autochartist wrote in Futures Technical Analysis - TD.

Broke through Support level of 65.8250 at 24-Feb-2020 10:00 EST

Tags: HE
0 Likes
494 Views

You may also like

US T-Bond up to 168.3938
February 11, 2021
US T-Bond down to 145.3707
January 9, 2019
Light Sweet Crude Oil Front Month up to 14.7320
April 22, 2020

Comments are closed.

Pfizer Inc. (PFE) excessive bearish movement Silver Front Month down to 18.1435

Futures Technical Analysis – TD

Light Sweet Crude Oil Front Month up to 67.9800

March 9, 2021 11:17 am | By Autochartist

Rising Wedge identified at 09-Mar-2021 05:00 EST. This pattern is... Read more →

Feeder Cattle Front Month down to 137.2250

March 9, 2021 11:17 am | By Autochartist

Channel Down identified at 08-Mar-2021 14:00 EST. This pattern is... Read more →

Soybean Oil up to 53.2300

March 9, 2021 11:17 am | By Autochartist

Channel Up identified at 09-Mar-2021 04:30 EST. This pattern is... Read more →

Silver Front Month up to 26.5600

March 9, 2021 11:17 am | By Autochartist

Approaching Resistance level of 26.5600 identified at 09-Mar-2021 04:00 EST Read more →

10 year T-Note up to 133.1644

March 9, 2021 11:17 am | By Autochartist

Falling Wedge has broken through the resistance line at 09-Mar-2021... Read more →

  • About Us
  • Privacy Policy
  • Disclaimer
  • Terms and Conditions
  • Get started for FREE
  • Contact Us
Copyright © 2020 Autochartist.com. All rights reserved.
This site uses cookies: Find out more.