Help & Documentation
  • Home
  • Sign In
  • Contact Us
  • Home
  • Sign In
  • Contact Us

KC HRW Wheat down to 498.5296

/Futures Technical Analysis - TD/KC HRW Wheat down to 498.5296

KC HRW Wheat down to 498.5296

Posted on January 10, 2019 by Autochartist wrote in Futures Technical Analysis - TD.

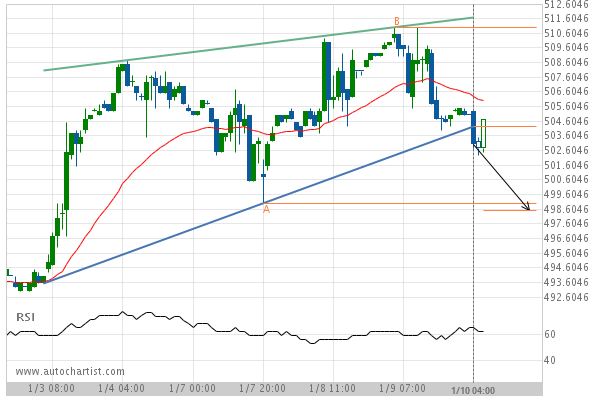
Rising Wedge has broken through the support line at 10-Jan-2019 04:00 EST. Possible bearish price movement forecast for the next 2 days towards 498.5296.

Tags: CBOT, KE
0 Likes
785 Views

You may also like

Gold Front Month down to 1501.6000
August 19, 2019
Gold Front Month up to 1698.0000
March 30, 2020
KC HRW Wheat down to 414.7869
August 7, 2019

Comments are closed.

Silver Front Month up to 15.9550 Soybean Oil up to 28.8000

Futures Technical Analysis – TD

Light Sweet Crude Oil Front Month up to 67.9800

March 9, 2021 11:17 am | By Autochartist

Rising Wedge identified at 09-Mar-2021 05:00 EST. This pattern is... Read more →

Feeder Cattle Front Month down to 137.2250

March 9, 2021 11:17 am | By Autochartist

Channel Down identified at 08-Mar-2021 14:00 EST. This pattern is... Read more →

Soybean Oil up to 53.2300

March 9, 2021 11:17 am | By Autochartist

Channel Up identified at 09-Mar-2021 04:30 EST. This pattern is... Read more →

Silver Front Month up to 26.5600

March 9, 2021 11:17 am | By Autochartist

Approaching Resistance level of 26.5600 identified at 09-Mar-2021 04:00 EST Read more →

10 year T-Note up to 133.1644

March 9, 2021 11:17 am | By Autochartist

Falling Wedge has broken through the resistance line at 09-Mar-2021... Read more →

  • About Us
  • Privacy Policy
  • Disclaimer
  • Terms and Conditions
  • Get started for FREE
  • Contact Us
Copyright © 2020 Autochartist.com. All rights reserved.
This site uses cookies: Find out more.