Help & Documentation
  • Home
  • Sign In
  • Contact Us
  • Home
  • Sign In
  • Contact Us

KC HRW Wheat down to 470.5258

/Futures Technical Analysis - TD/KC HRW Wheat down to 470.5258

KC HRW Wheat down to 470.5258

Posted on March 25, 2020 by Autochartist wrote in Futures Technical Analysis - TD.

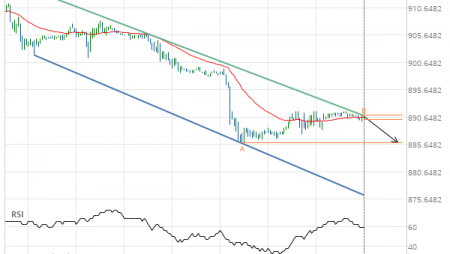
Rising Wedge has broken through the support line at 25-Mar-2020 07:00 EDT. Possible bearish price movement forecast for the next day towards 470.5258.

Tags: CBOT, KE
0 Likes
699 Views

You may also like

CORN JULY 2019 down to 410.7500
June 10, 2019
Gold Front Month up to 1262.2000
December 20, 2018
Soybean Oil down to 33.8000
December 24, 2019

Comments are closed.

Trade of the Day: GBP/JPY US T-Bond up to 181.2500

Futures Technical Analysis – TD

Light Sweet Crude Oil Front Month up to 67.9800

March 9, 2021 11:17 am | By Autochartist

Rising Wedge identified at 09-Mar-2021 05:00 EST. This pattern is... Read more →

Feeder Cattle Front Month down to 137.2250

March 9, 2021 11:17 am | By Autochartist

Channel Down identified at 08-Mar-2021 14:00 EST. This pattern is... Read more →

Soybean Oil up to 53.2300

March 9, 2021 11:17 am | By Autochartist

Channel Up identified at 09-Mar-2021 04:30 EST. This pattern is... Read more →

Silver Front Month up to 26.5600

March 9, 2021 11:17 am | By Autochartist

Approaching Resistance level of 26.5600 identified at 09-Mar-2021 04:00 EST Read more →

10 year T-Note up to 133.1644

March 9, 2021 11:17 am | By Autochartist

Falling Wedge has broken through the resistance line at 09-Mar-2021... Read more →

  • About Us
  • Privacy Policy
  • Disclaimer
  • Terms and Conditions
  • Get started for FREE
  • Contact Us
Copyright © 2022 Autochartist.com. All rights reserved.
This site uses cookies: Find out more.