Help & Documentation
  • Home
  • Sign In
  • Contact Us
  • Home
  • Sign In
  • Contact Us

Johnson & Johnson () up to 139.59

/US Stocks Technical Analysis - TD/Johnson & Johnson () up to 139.59

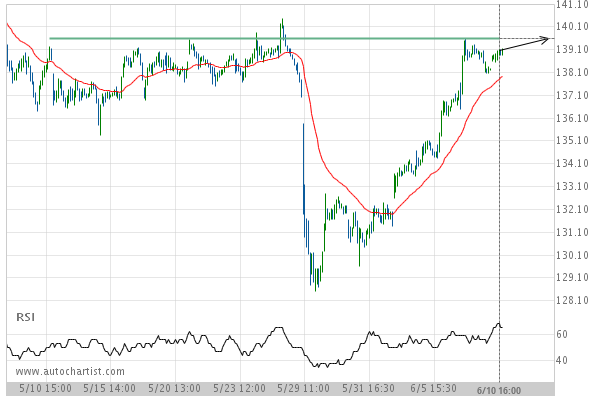
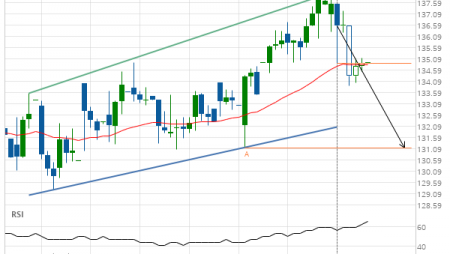
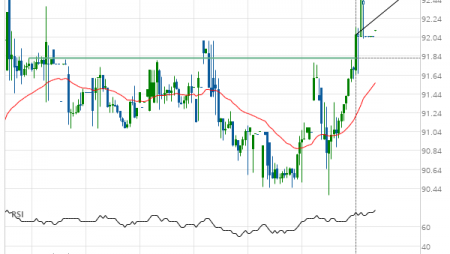
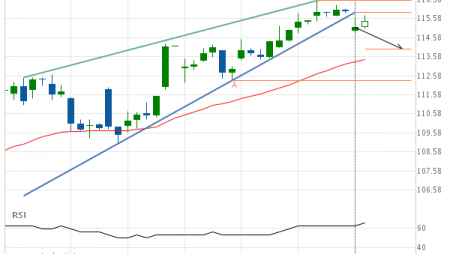
Johnson & Johnson () up to 139.59

Posted on June 11, 2019 by Autochartist wrote in US Stocks Technical Analysis - TD.

Approaching Resistance level of 139.59 identified at 10-Jun-2019 16:00 EDT

Tags: JNJ, Johnson & Johnson
0 Likes
781 Views

You may also like

Procter & Gamble Co. (PG) up to 111.75
July 3, 2019
Exxon Mobil Corp. (XOM) down to 78.70
April 29, 2019
Wal-Mart Stores (WMT) down to 111.77
July 25, 2019

Comments are closed.

Verizon Communications Inc. (VZ) down to 54.26 Pfizer Inc. (PFE) up to 43.25

US Stocks Technical Analysis – TD

Merck & Co. Inc. (MRK) up to 75.56

March 9, 2021 11:13 am | By Autochartist

Rising Wedge identified at 08-Mar-2021 19:30 EST. This pattern is... Read more →

Jpmorgan Chase & Co. (JPM) down to 147.97

March 9, 2021 11:13 am | By Autochartist

Channel Up identified at 08-Mar-2021 19:00 EST. This pattern is... Read more →

Visa (V) down to 215.41

March 9, 2021 11:13 am | By Autochartist

Triangle identified at 08-Mar-2021 20:00 EST. This pattern is still... Read more →

Home Depot Inc. (HD) down to 247.10

March 9, 2021 11:13 am | By Autochartist

Channel Down identified at 08-Mar-2021 16:00 EST. This pattern is... Read more →

Intel Corporation () down to 58.10

March 9, 2021 11:13 am | By Autochartist

Approaching Support level of 58.10 identified at 08-Mar-2021 16:00 EST Read more →

  • About Us
  • Privacy Policy
  • Disclaimer
  • Terms and Conditions
  • Get started for FREE
  • Contact Us
Copyright © 2022 Autochartist.com. All rights reserved.
This site uses cookies: Find out more.