Help & Documentation
  • Home
  • Sign In
  • Contact Us
  • Home
  • Sign In
  • Contact Us

Johnson & Johnson () down to 140.39

/US Stocks Technical Analysis - TD/Johnson & Johnson () down to 140.39

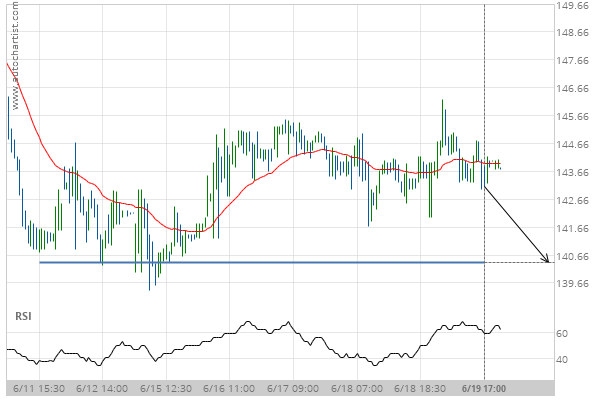
Johnson & Johnson () down to 140.39

Posted on June 22, 2020 by Autochartist wrote in US Stocks Technical Analysis - TD.

Approaching Support level of 140.39 identified at 19-Jun-2020 17:00 EDT

Tags: JNJ, Johnson & Johnson
0 Likes
343 Views

You may also like

Apple Inc. (AAPL) down to 351.28
July 8, 2020
Intel Corporation (INTC) up to 56.56
April 16, 2019
Johnson & Johnson (JNJ) down to 156.90
March 1, 2021

Comments are closed.

Pfizer Inc. (PFE) up to 34.70 Merck & Co. Inc. (MRK) up to 78.88

US Stocks Technical Analysis – TD

Merck & Co. Inc. (MRK) up to 75.56

March 9, 2021 11:13 am | By Autochartist

Rising Wedge identified at 08-Mar-2021 19:30 EST. This pattern is... Read more →

Visa (V) down to 215.41

March 9, 2021 11:13 am | By Autochartist

Triangle identified at 08-Mar-2021 20:00 EST. This pattern is still... Read more →

Jpmorgan Chase & Co. (JPM) down to 147.97

March 9, 2021 11:13 am | By Autochartist

Channel Up identified at 08-Mar-2021 19:00 EST. This pattern is... Read more →

Home Depot Inc. (HD) down to 247.10

March 9, 2021 11:13 am | By Autochartist

Channel Down identified at 08-Mar-2021 16:00 EST. This pattern is... Read more →

Intel Corporation () down to 58.10

March 9, 2021 11:13 am | By Autochartist

Approaching Support level of 58.10 identified at 08-Mar-2021 16:00 EST Read more →

  • About Us
  • Privacy Policy
  • Disclaimer
  • Terms and Conditions
  • Get started for FREE
  • Contact Us
Copyright © 2020 Autochartist.com. All rights reserved.
This site uses cookies: Find out more.