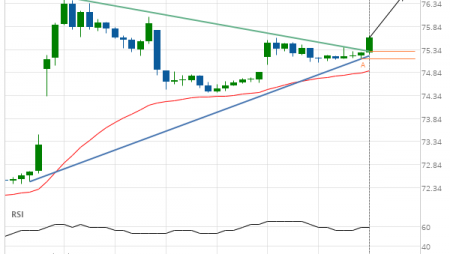
Intel Corporation (INTC) up to 67.66
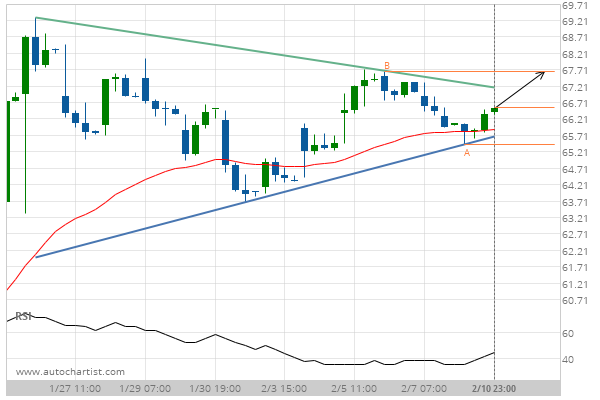
Triangle identified at 10-Feb-2020 23:00 EST. This pattern is still in the process of forming. Possible bullish price movement towards the resistance 67.66 within the next 3 days.
Triangle identified at 10-Feb-2020 23:00 EST. This pattern is still in the process of forming. Possible bullish price movement towards the resistance 67.66 within the next 3 days.