Intel Corporation (INTC) up to 60.03
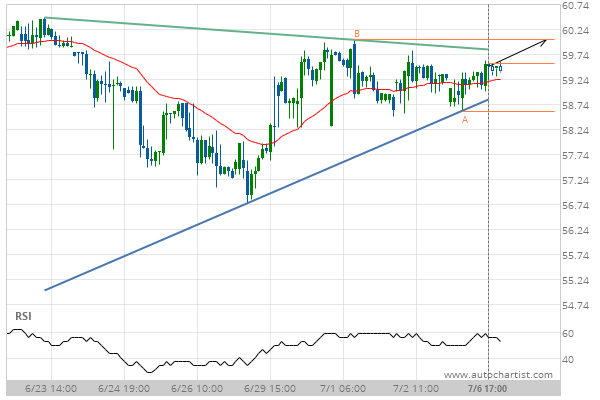
Triangle identified at 06-Jul-2020 17:00 EDT. This pattern is still in the process of forming. Possible bullish price movement towards the resistance 60.03 within the next day.
Triangle identified at 06-Jul-2020 17:00 EDT. This pattern is still in the process of forming. Possible bullish price movement towards the resistance 60.03 within the next day.