Help & Documentation
  • Home
  • Sign In
  • Contact Us
  • Home
  • Sign In
  • Contact Us

Intel Corporation (INTC) up to 56.55

/US Stocks Technical Analysis - TD/Intel Corporation (INTC) up to 56.55

Intel Corporation (INTC) up to 56.55

Posted on March 25, 2020 by Autochartist wrote in US Stocks Technical Analysis - TD.

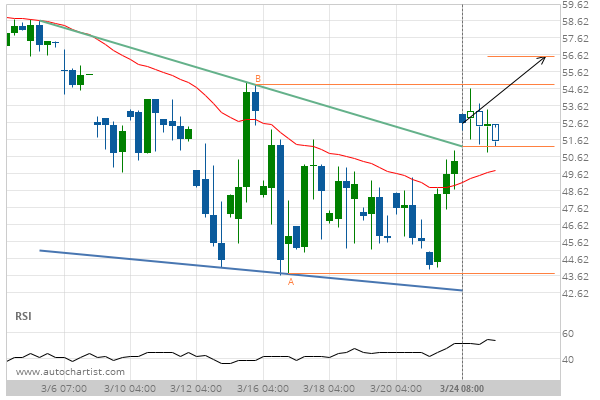
Falling Wedge has broken through the resistance line at 24-Mar-2020 08:00 EDT. Possible bullish price movement forecast for the next 2 days towards 56.55.

Tags: INTC, Intel Corporation, NASDAQ
0 Likes
554 Views

You may also like

Apple Inc. () down to 193.79
July 9, 2019
Coca-Cola Co. (KO) up to 52.20
July 3, 2019
Visa () up to 191.68
May 26, 2020

Comments are closed.

Procter & Gamble Co. (PG) up to 121.50 3m Co. () up to 148.41

US Stocks Technical Analysis – TD

Merck & Co. Inc. (MRK) up to 75.56

March 9, 2021 11:13 am | By Autochartist

Rising Wedge identified at 08-Mar-2021 19:30 EST. This pattern is... Read more →

Jpmorgan Chase & Co. (JPM) down to 147.97

March 9, 2021 11:13 am | By Autochartist

Channel Up identified at 08-Mar-2021 19:00 EST. This pattern is... Read more →

Visa (V) down to 215.41

March 9, 2021 11:13 am | By Autochartist

Triangle identified at 08-Mar-2021 20:00 EST. This pattern is still... Read more →

Home Depot Inc. (HD) down to 247.10

March 9, 2021 11:13 am | By Autochartist

Channel Down identified at 08-Mar-2021 16:00 EST. This pattern is... Read more →

Intel Corporation () down to 58.10

March 9, 2021 11:13 am | By Autochartist

Approaching Support level of 58.10 identified at 08-Mar-2021 16:00 EST Read more →

  • About Us
  • Privacy Policy
  • Disclaimer
  • Terms and Conditions
  • Get started for FREE
  • Contact Us
Copyright © 2022 Autochartist.com. All rights reserved.
This site uses cookies: Find out more.