Help & Documentation
  • Home
  • Sign In
  • Contact Us
  • Home
  • Sign In
  • Contact Us

Home Depot Inc. () up to 220.49

/US Stocks Technical Analysis - TD/Home Depot Inc. () up to 220.49

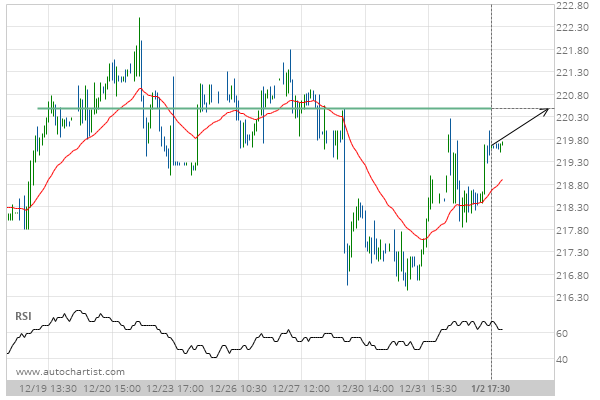
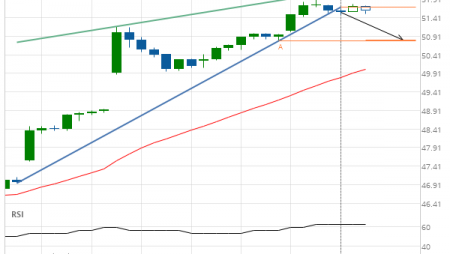
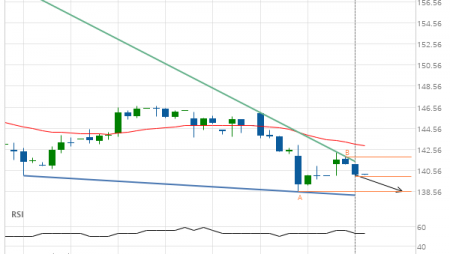
Home Depot Inc. () up to 220.49

Posted on January 3, 2020 by Autochartist wrote in US Stocks Technical Analysis - TD.

Approaching Resistance level of 220.49 identified at 02-Jan-2020 17:30 EST

Tags: HD, Home Depot Inc.
0 Likes
639 Views

You may also like

Merck & Co. Inc. (MRK) up to 73.81
January 31, 2019
Microsoft Corporation (MSFT) up to 170.58
April 9, 2020
Procter & Gamble Co. (PG) down to 89.08
February 18, 2019

Comments are closed.

Soybean Meal down to 301.5000 General Electric Co. (GE) up to 12.03

US Stocks Technical Analysis – TD

Merck & Co. Inc. (MRK) up to 75.56

March 9, 2021 11:13 am | By Autochartist

Rising Wedge identified at 08-Mar-2021 19:30 EST. This pattern is... Read more →

Jpmorgan Chase & Co. (JPM) down to 147.97

March 9, 2021 11:13 am | By Autochartist

Channel Up identified at 08-Mar-2021 19:00 EST. This pattern is... Read more →

Visa (V) down to 215.41

March 9, 2021 11:13 am | By Autochartist

Triangle identified at 08-Mar-2021 20:00 EST. This pattern is still... Read more →

Home Depot Inc. (HD) down to 247.10

March 9, 2021 11:13 am | By Autochartist

Channel Down identified at 08-Mar-2021 16:00 EST. This pattern is... Read more →

Intel Corporation () down to 58.10

March 9, 2021 11:13 am | By Autochartist

Approaching Support level of 58.10 identified at 08-Mar-2021 16:00 EST Read more →

  • About Us
  • Privacy Policy
  • Disclaimer
  • Terms and Conditions
  • Get started for FREE
  • Contact Us
Copyright © 2022 Autochartist.com. All rights reserved.
This site uses cookies: Find out more.