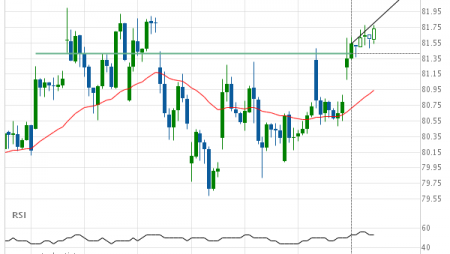
Home Depot Inc. (HD) up to 294.49
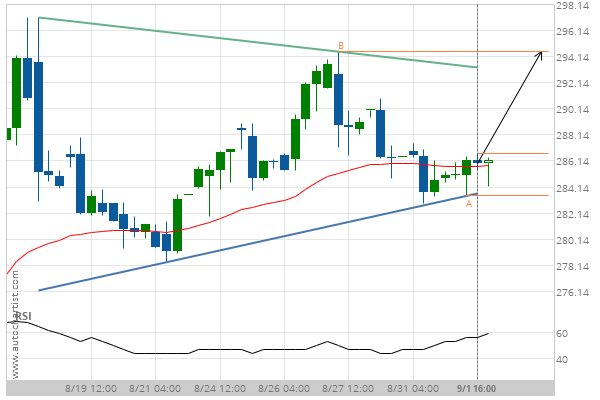
Triangle identified at 01-Sep-2020 16:00 EDT. This pattern is still in the process of forming. Possible bullish price movement towards the resistance 294.49 within the next 2 days.
Triangle identified at 01-Sep-2020 16:00 EDT. This pattern is still in the process of forming. Possible bullish price movement towards the resistance 294.49 within the next 2 days.