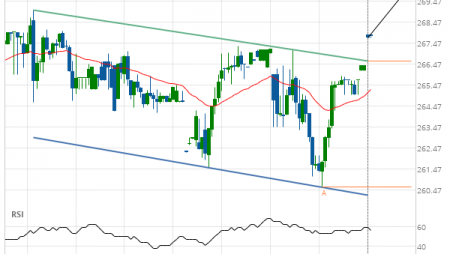
Goldman Sachs Group Inc. (GS) up to 224.67
![](https://trader.autochartist.com/wp-content/uploads/2019/11/TDUSStocksTA5dc94364ae2e1d5fce9842a4.png)
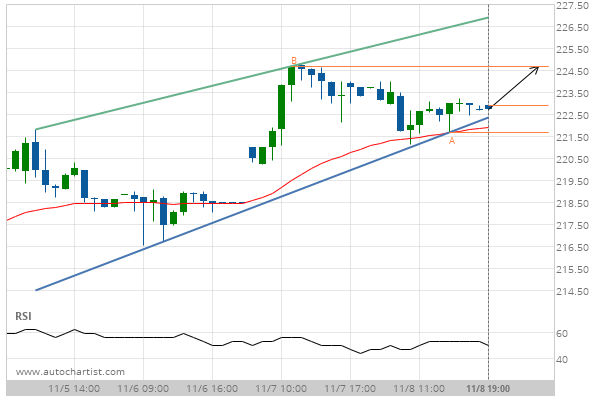
Rising Wedge identified at 08-Nov-2019 19:00 EST. This pattern is still in the process of forming. Possible bullish price movement towards the resistance 224.67 within the next 15 hours.