Goldman Sachs Group Inc. (GS) down to 318.23
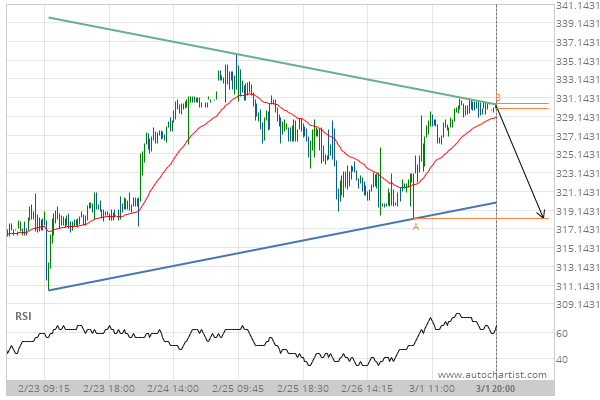
Triangle identified at 01-Mar-2021 20:00 EST. This pattern is still in the process of forming. Possible bearish price movement towards the support 318.23 within the next 20 hours.
Triangle identified at 01-Mar-2021 20:00 EST. This pattern is still in the process of forming. Possible bearish price movement towards the support 318.23 within the next 20 hours.