Goldman Sachs Group Inc. (GS) down to 208.40
![](https://trader.autochartist.com/wp-content/uploads/2018/10/TDUSStocksTA5bd6eb42b760e4cc38333a27.png)
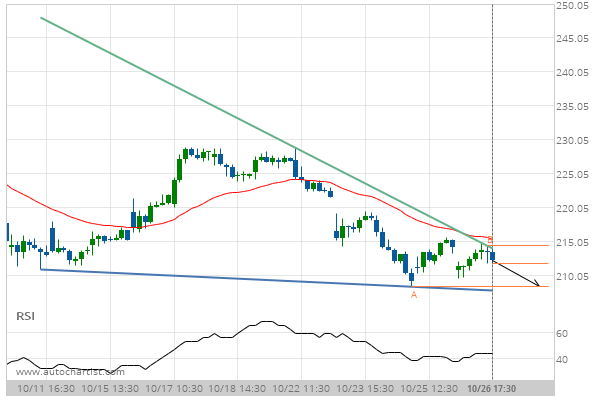
Falling Wedge identified at 26-Oct-2018 17:30 EDT. This pattern is still in the process of forming. Possible bearish price movement towards the support 208.40 within the next 2 days.