Help & Documentation
  • Home
  • Sign In
  • Contact Us
  • Home
  • Sign In
  • Contact Us

Goldman Sachs Group Inc. () down to 275.95

/US Stocks Technical Analysis - TD/Goldman Sachs Group Inc. () down to 275.95

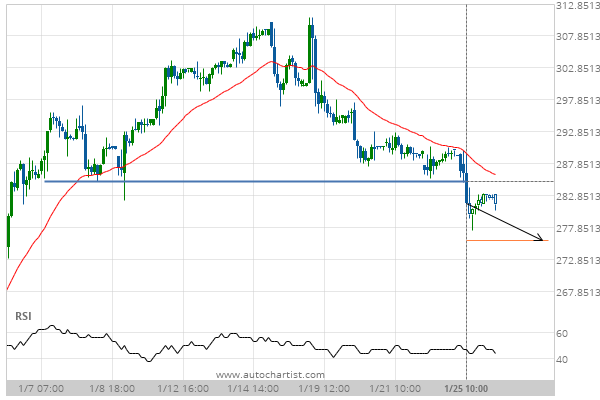
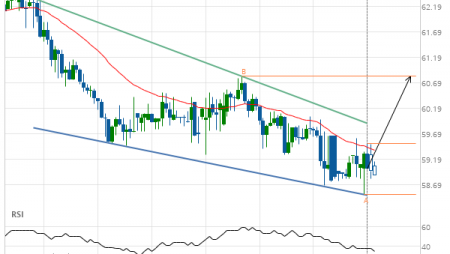
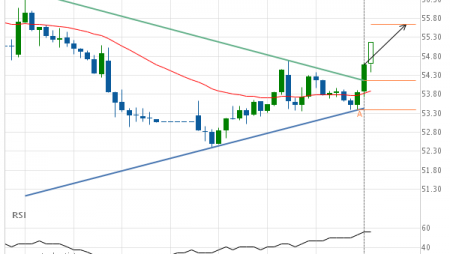
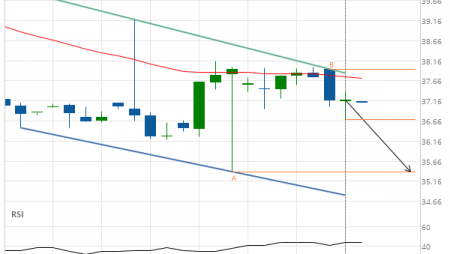
Goldman Sachs Group Inc. () down to 275.95

Posted on January 26, 2021 by Autochartist wrote in US Stocks Technical Analysis - TD.

Broke through Support level of 285.06 at 25-Jan-2021 10:00 EST

Tags: Goldman Sachs Group Inc., GS
0 Likes
344 Views

You may also like

Intel Corporation () down to 44.18
November 11, 2020
Nike Inc. Cl B (NKE) down to 81.83
May 14, 2019
General Electric Co. (GE) down to 10.10
June 27, 2019

Comments are closed.

Coca-Cola Co. (KO) up to 48.86 Unitedhealth Group Inc. () down to 343.61

US Stocks Technical Analysis – TD

Merck & Co. Inc. (MRK) up to 75.56

March 9, 2021 11:13 am | By Autochartist

Rising Wedge identified at 08-Mar-2021 19:30 EST. This pattern is... Read more →

Jpmorgan Chase & Co. (JPM) down to 147.97

March 9, 2021 11:13 am | By Autochartist

Channel Up identified at 08-Mar-2021 19:00 EST. This pattern is... Read more →

Visa (V) down to 215.41

March 9, 2021 11:13 am | By Autochartist

Triangle identified at 08-Mar-2021 20:00 EST. This pattern is still... Read more →

Home Depot Inc. (HD) down to 247.10

March 9, 2021 11:13 am | By Autochartist

Channel Down identified at 08-Mar-2021 16:00 EST. This pattern is... Read more →

Intel Corporation () down to 58.10

March 9, 2021 11:13 am | By Autochartist

Approaching Support level of 58.10 identified at 08-Mar-2021 16:00 EST Read more →

  • About Us
  • Privacy Policy
  • Disclaimer
  • Terms and Conditions
  • Get started for FREE
  • Contact Us
Copyright © 2022 Autochartist.com. All rights reserved.
This site uses cookies: Find out more.